

Hepatic overexpression of a constitutively active form of liver glycogen synthase improves glucose homeostasis
- PMID: 20841354
- PMCID: PMC2988323
- DOI: 10.1074/jbc.M110.157396
Hepatic overexpression of a constitutively active form of liver glycogen synthase improves glucose homeostasis
Abstract
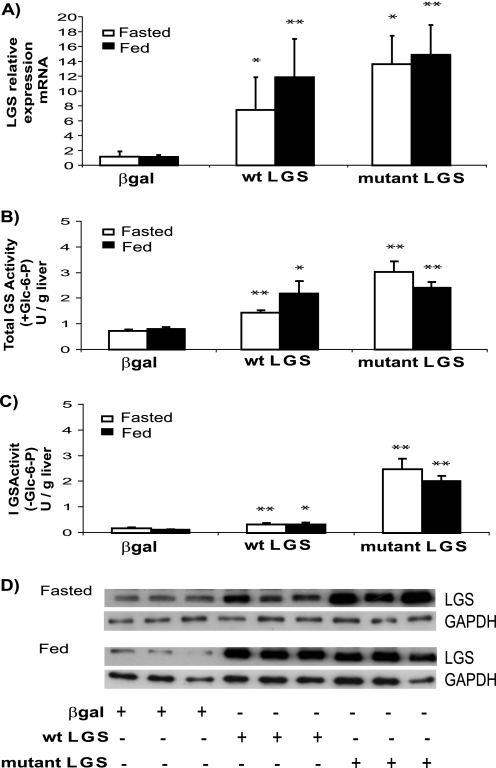
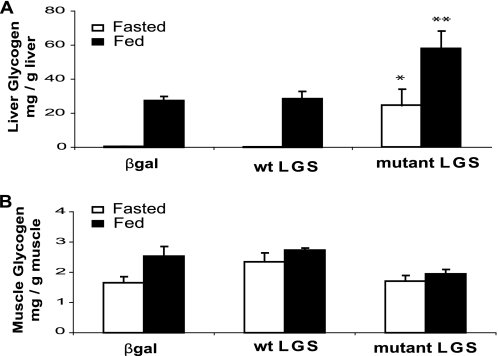
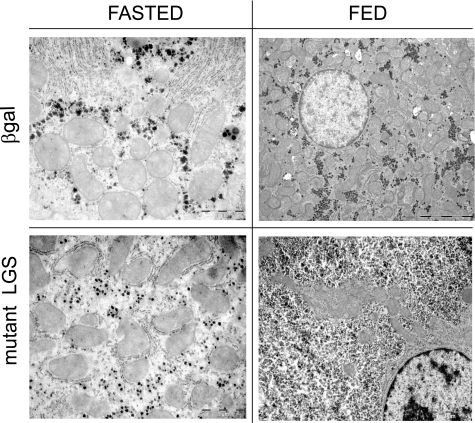
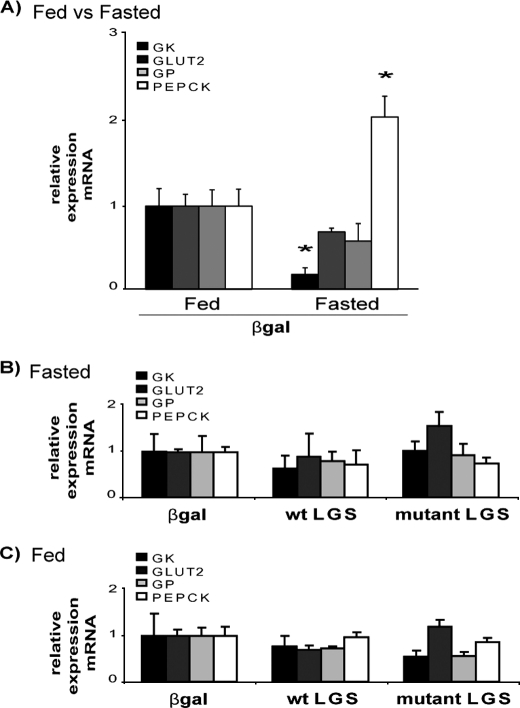
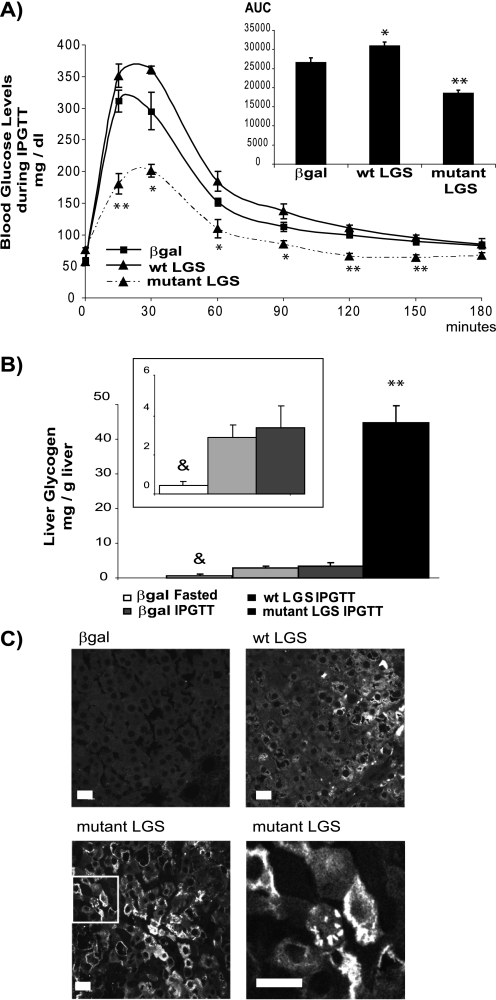
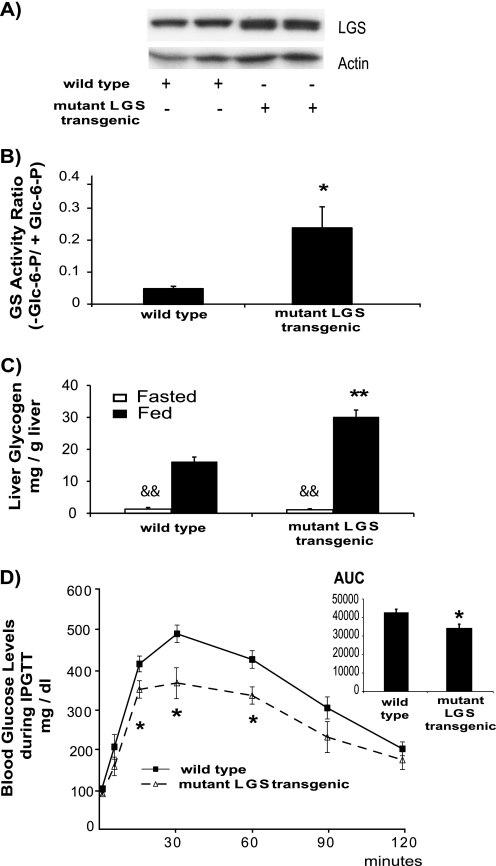
In this study, we tested the efficacy of increasing liver glycogen synthase to improve blood glucose homeostasis. The overexpression of wild-type liver glycogen synthase in rats had no effect on blood glucose homeostasis in either the fed or the fasted state. In contrast, the expression of a constitutively active mutant form of the enzyme caused a significant lowering of blood glucose in the former but not the latter state. Moreover, it markedly enhanced the clearance of blood glucose when fasted rats were challenged with a glucose load. Hepatic glycogen stores in rats overexpressing the activated mutant form of liver glycogen synthase were enhanced in the fed state and in response to an oral glucose load but showed a net decline during fasting. In order to test whether these effects were maintained during long term activation of liver glycogen synthase, we generated liver-specific transgenic mice expressing the constitutively active LGS form. These mice also showed an enhanced capacity to store glycogen in the fed state and an improved glucose tolerance when challenged with a glucose load. Thus, we conclude that the activation of liver glycogen synthase improves glucose tolerance in the fed state without compromising glycogenolysis in the postabsorptive state. On the basis of these findings, we propose that the activation of liver glycogen synthase may provide a potential strategy for improvement of glucose tolerance in the postprandial state.
Figures
Similar articles
-
Glycogen concentration and regulation of synthase activity in rat liver in vivo.Arch Biochem Biophys. 1995 Apr 20;318(2):271-8. doi: 10.1006/abbi.1995.1230. Arch Biochem Biophys. 1995. PMID: 7733654
-
Active Glycogen Synthase in the Liver Prevents High-Fat Diet-Induced Glucose Intolerance, Decreases Food Intake, and Lowers Body Weight.Int J Mol Sci. 2023 Jan 29;24(3):2574. doi: 10.3390/ijms24032574. Int J Mol Sci. 2023. PMID: 36768897 Free PMC article.
-
Altered mechanism of glucagon-mediated hepatic glycogenolysis during long-term starvation in the rat.Metabolism. 1978 Oct;27(10):1491-8. doi: 10.1016/s0026-0495(78)80021-3. Metabolism. 1978. PMID: 211368
-
Glucocorticoids and hepatic glycogen metabolism.Monogr Endocrinol. 1979;12:517-33. doi: 10.1007/978-3-642-81265-1_27. Monogr Endocrinol. 1979. PMID: 114752 Review.
-
Interactions between insulin and alpha 1-adrenergic agents in the regulation of glycogen metabolism in isolated hepatocytes.J Biol Chem. 1985 May 25;260(10):5963-73. J Biol Chem. 1985. PMID: 2860104 Review.
Cited by
-
Pueraria lobata root polysaccharide alleviates glucose and lipid metabolic dysfunction in diabetic db/db mice.Pharm Biol. 2021 Dec;59(1):382-390. doi: 10.1080/13880209.2021.1898648. Pharm Biol. 2021. PMID: 33794128 Free PMC article.
-
Mechanisms of Insulin Action and Insulin Resistance.Physiol Rev. 2018 Oct 1;98(4):2133-2223. doi: 10.1152/physrev.00063.2017. Physiol Rev. 2018. PMID: 30067154 Free PMC article. Review.
-
Endoplasmic Reticulum Stress Inducer Tunicamycin Alters Hepatic Energy Homeostasis in Mice.Int J Mol Sci. 2017 Aug 4;18(8):1710. doi: 10.3390/ijms18081710. Int J Mol Sci. 2017. PMID: 28777337 Free PMC article.
-
Hepatic overexpression of protein targeting to glycogen attenuates obesity and improves hyperglycemia in db/db mice.Front Endocrinol (Lausanne). 2022 Sep 9;13:969924. doi: 10.3389/fendo.2022.969924. eCollection 2022. Front Endocrinol (Lausanne). 2022. PMID: 36157460 Free PMC article.
-
Restoration of hepatic glycogen deposition reduces hyperglycaemia, hyperphagia and gluconeogenic enzymes in a streptozotocin-induced model of diabetes in rats.Diabetologia. 2011 Oct;54(10):2639-48. doi: 10.1007/s00125-011-2238-x. Epub 2011 Aug 3. Diabetologia. 2011. PMID: 21811873
References
-
- Agius L., Peak M., Newgard C. B., Gomez-Foix A. M., Guinovart J. J. (1996) J. Biol. Chem. 271, 30479–30486 - PubMed
-
- Hariharan N., Farrelly D., Hagan D., Hillyer D., Arbeeny C., Sabrah T., Treloar A., Brown K., Kalinowski S., Mookhtiar K. (1997) Diabetes 46, 11–16 - PubMed
-
- Niswender K. D., Shiota M., Postic C., Cherrington A. D., Magnuson M. A. (1997) J. Biol. Chem. 272, 22570–22575 - PubMed
-
- O'Doherty R. M., Lehman D. L., Télémaque-Potts S., Newgard C. B. (1999) Diabetes 48, 2022–2027 - PubMed
-
- Printen J. A., Brady M. J., Saltiel A. R. (1997) Science 275, 1475–1478 - PubMed
Publication types
MeSH terms
Substances
LinkOut - more resources
Full Text Sources
Medical
Molecular Biology Databases
