. 2010 Dec;1803(12):1359-67.
doi: 10.1016/j.bbamcr.2010.09.002. Epub 2010 Sep 15.

Activation of the sonic hedgehog signaling controls human pulmonary arterial smooth muscle cell proliferation in response to hypoxia

Affiliations

Activation of the sonic hedgehog signaling controls human pulmonary arterial smooth muscle cell proliferation in response to hypoxia

Guansong Wang et al. Biochim Biophys Acta. 2010 Dec.

Abstract

The hedgehog signal pathway plays a crucial role in the angiogenesis and vascular remodeling. However, the function of this pathway in the pulmonary vascular smooth cell proliferation in response to hypoxia remains unknown. In this study, we have demonstrated that the main components of the hedgehog pathway, including sonic hedgehog (SHH), patched1 (PTCH1), smoothened (SMO), GLI and hypoxia-inducible factor 1 (HIF1) are expressed in the human pulmonary arterial smooth muscle cells (HPASMCs). Interestingly, hypoxia significantly enhanced the expression of SHH and HIF1, facilitated the translocation of GLI1 into the nuclei, and promoted the proliferation of HPASMCs. Furthermore, direct activation of the SHH pathway through incubation with the purified recombinant human SHH or with purmorphamine and SAG, two Smo agonists, also enhanced the proliferation of HPASMCs. Importantly, the treatment with anti-SHH and anti-HIF1 antibodies or cyclopamine, a specific SMO inhibitor, markedly inhibited the nuclear translocation of GLI1 and cell proliferation in the HPASMCs induced by hypoxia and activation of the SHH pathway. Moreover, the treatment with cyclopamine increased apoptosis in the hypoxic HPASMCs. These data strongly demonstrate for the first time that the SHH signaling plays a crucial role in the regulation of HPASMC growth in response to hypoxia.


Figures

Fig. 1
Fig. 1
mRNA expression of SHH, PTCH1, SMO, GLI1, GLI2 and GLI3 in the HPASMCs as determined by RT-PCR. The expression of GAPDH is used a positive control. Similar results ere obtained in at least three separate experiments. Molecular mass (bp) is indicated at the left.
Fig. 2
Fig. 2
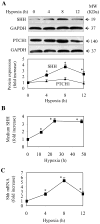
Enhancement of SHH expression at the protein and mRNA levels in the HPASMCs in response to hypoxia. (A) SHH and PTCH1 protein expression in the normoxic and hypoxic HPASMCs. The HPASMCs were exposed to hypoxia for 4, 8 and 12 h and SHH and PTCH1 expression was determined by immunoblotting using anti-SHH and anti-PTCH1 antibodies, respectively. Representative Western blots are shown and GAPDH expression is used a sample loading control. Bottom panel: quantitative data of SHH and PTCH1 expression normalized to GAPDH in the HPASMCs. Molecular mass is indicated at the right. (B) SHH protein expression in the culture medium of the HPASMCs after hypoxia for 12, 24 and 48 h measured by ELISA. The values are presented as the means ± S.E. of six independent experiments. C, Expression of SHH mRNA in the HPASMCs after hypoxia as determined by RT-PCR. The values are presented as the means ± S.E. of three independent experiments. *P < 0.05 compared the normoxic group (time 0).
Fig. 3
Fig. 3
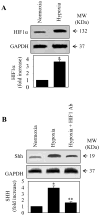
Augmentation of HIF1α expression and attenuation of SHH expression by anti-HIF1α antibodies in the HPASMCs in response to hypoxia. (A) HIF1α expression in the normoxic and hypoxic HPASMCs. The HPASMCs were exposed to hypoxia for 8 h and HIF1α expression was determined by immunoblotting using anti-HIF1α antibodies. Upper panel: a representative Western blot showing HIF1α expression; Middle panel: GAPDH expression as a control; Lower panel: quantitative data of HIF1α expression normalized to GAPDH in the HPASMCs. Molecular mass is indicated at the right. (B) Inhibition of hypoxia-induced SHH expression by pretreatment with anti-HIF1α antibodies. The HPASMCs were subjected to hypoxia for 8 h with or without pretreatment with anti-HIF1α antibodies at a concentration of 1 μg/ml for 24 h and SHH expression was determined by immunoblotting using anti-SHH antibodies. Upper panel: a representative Western blot showing SHH expression; Middle panel: GAPDH expression as a control; Lower panel: quantitative data of SHH expression normalized to GAPDH in the HPASMCs. Molecular mass is indicated at the right. The values in A and B are presented as the means ± S.E. of three independent experiments. * and **P < 0.05 compared the normoxia and hypoxia groups, respectively.
Fig. 4
Fig. 4
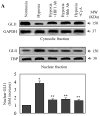
Nuclear translocation of GLI1 in the HPASMCs after hypoxia and its inhibition by pretreatment with anti-SHH and anti-HIF1α antibodies and CyA. The HPASMCs were subjected to hypoxia for 24 h with or without pretreatment with antibodies at a concentration of 1 μg/ml for 24 h or CyA at 10 μM for 2 h. (A) GLI1 expression in the cytosolic and nuclear fractions. The nuclear proteins were extracted from the HPASMCs and the amount of GLI1 in the nuclear and cytosolic fractions was determined by immunoblotting using anti-GLI1 antibodies. Expression of GAPDH and TATA binding protein (TBP) was used a sample loading control for cytosolic and nuclear proteins, respectively. Molecular mass is indicated at the left. The bottom panel is the quantitative data of the nuclear GLI1 expression. (B) Representative images showing the nuclear translocation of GLI1 in the HPASMCs after hypoxia and the effect of pretreatments with anti-SHH and HIF1α antibodies and CyA. The images were taken by immunofluorescence microscopy following staining with anti-GLI1 antibodies as described under the “Experimental procedures”. Scale bar, 20 μM. (C) Quantitative data of the fluorescence intensity of GLI1 protein expression in the nuclear region of the HPASMCs (n = 60 cells). In (A) and (C), the quantitative data are presented as the means ± S.E. of three independent experiments. * and ** p<0.05 compared the normoxia and hypoxia groups, respectively.
Fig. 4
Fig. 4
Nuclear translocation of GLI1 in the HPASMCs after hypoxia and its inhibition by pretreatment with anti-SHH and anti-HIF1α antibodies and CyA. The HPASMCs were subjected to hypoxia for 24 h with or without pretreatment with antibodies at a concentration of 1 μg/ml for 24 h or CyA at 10 μM for 2 h. (A) GLI1 expression in the cytosolic and nuclear fractions. The nuclear proteins were extracted from the HPASMCs and the amount of GLI1 in the nuclear and cytosolic fractions was determined by immunoblotting using anti-GLI1 antibodies. Expression of GAPDH and TATA binding protein (TBP) was used a sample loading control for cytosolic and nuclear proteins, respectively. Molecular mass is indicated at the left. The bottom panel is the quantitative data of the nuclear GLI1 expression. (B) Representative images showing the nuclear translocation of GLI1 in the HPASMCs after hypoxia and the effect of pretreatments with anti-SHH and HIF1α antibodies and CyA. The images were taken by immunofluorescence microscopy following staining with anti-GLI1 antibodies as described under the “Experimental procedures”. Scale bar, 20 μM. (C) Quantitative data of the fluorescence intensity of GLI1 protein expression in the nuclear region of the HPASMCs (n = 60 cells). In (A) and (C), the quantitative data are presented as the means ± S.E. of three independent experiments. * and ** p<0.05 compared the normoxia and hypoxia groups, respectively.
Fig. 5
Fig. 5
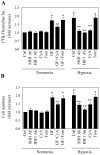
Hypoxia-induced cell proliferation of the HPASMCs and its inhibition by pretreatments with anti-SHH and anti-HIF1α antibodies and CyA. The HPASMCs were starved for 24 h, treated with anti-SHH or anti-HIF1α antibodies (1 μg/ml), growth factors (GF), CyA (10μM) or Tom (10μM) and then subjected to hypoxia. Cell proliferation was measured by [3H]-thymidine incorporation (A) and counting cell numbers (B) as described in the “Experimental procedures”. The value of [3H]-thymidine incorporation at the basal level (Ctrl) is 760 ± 70 cpm per well. The values are expressed as the means ± S.E. of four independent experiments. * and ** P < 0.05 compared the normoxic and hypoxic groups, respectively. C. Cell proliferation induced by SHH, Pur and SAG in the HPASMCs. The HPASMCs were incubated with SHH at a concentration of 1.0 μg/ml for 24 h or treated with Pur (4 μM) or SAG (100 nM) in the presence or absence of CyA or Tom. Cell proliferation was evaluated by [3H]-thymidine incorporation as described in the “Experimental procedures”. The values are presented as the means ± S.E. of four independent experiments. * and ** P < 0.05 versus controls in the normoxia and hypoxia groups, respectively.
Fig. 5
Fig. 5
Hypoxia-induced cell proliferation of the HPASMCs and its inhibition by pretreatments with anti-SHH and anti-HIF1α antibodies and CyA. The HPASMCs were starved for 24 h, treated with anti-SHH or anti-HIF1α antibodies (1 μg/ml), growth factors (GF), CyA (10μM) or Tom (10μM) and then subjected to hypoxia. Cell proliferation was measured by [3H]-thymidine incorporation (A) and counting cell numbers (B) as described in the “Experimental procedures”. The value of [3H]-thymidine incorporation at the basal level (Ctrl) is 760 ± 70 cpm per well. The values are expressed as the means ± S.E. of four independent experiments. * and ** P < 0.05 compared the normoxic and hypoxic groups, respectively. C. Cell proliferation induced by SHH, Pur and SAG in the HPASMCs. The HPASMCs were incubated with SHH at a concentration of 1.0 μg/ml for 24 h or treated with Pur (4 μM) or SAG (100 nM) in the presence or absence of CyA or Tom. Cell proliferation was evaluated by [3H]-thymidine incorporation as described in the “Experimental procedures”. The values are presented as the means ± S.E. of four independent experiments. * and ** P < 0.05 versus controls in the normoxia and hypoxia groups, respectively.
Fig. 6
Fig. 6
Apoptosis induced by CyA in the HPASMCs. (A) Effect of CyA on the apoptosis of HPASMCs exposed to hypoxia. The HPASMCs were starved for 24 h, treated with ethanol (0.1%, Ctrl), CyA (10μM) or Tom (10μM) and then subjected to hypoxia. Apoptosis was measured by flow cytometry following staining with the Annexin V - FITC (Annexin V) and propidium iodide (PI). The lower left quadrants of each panel show the viable cells, which exclude PI and are negative for AV binding (B3, AV-/PI). The lower right quadrants represent the apoptotic cell, positive for AV binding and negative for PI uptake (B4, AV+/PI). The upper quadrants (left and right) represent the necrotic cells, positive for PI uptake with or without AV fluorescence. B1, fluorescence height of AV; B2, fluorescence height of PI. Data was taken from one out of six determinations in a typical experiment. Three such experiments were performed. (B) Quantitative data of the apoptotic cells in the B4 section presented as the means ± S.E. of four independent experiments. *P < 0.05 compared with control (Ctrl) in the hypoxic group.

Similar articles

Cited by

References

    1. Chan SY, Loscalzo J. Pathogenic mechanisms of pulmonary arterial hypertension. J Mol Cell Cardiol. 2008;44:14–30. - PMC - PubMed
    1. Mecham RP, Whitehouse LA, Wrenn DS, Parks WC, Griffin GL, Senior RM, Crouch EC, Stenmark KR, Voelkel NF. Smooth muscle-mediated connective tissue remodeling in pulmonary hypertension. Science. 1987;237:423–426. - PubMed
    1. Stenmark KR, Fagan KA, Frid MG. Hypoxia-induced pulmonary vascular remodeling: cellular and molecular mechanisms. Circ Res. 2006;99:675–691. - PubMed
    1. Orlandi A, Bochaton-Piallat ML, Gabbiani G, Spagnoli LG. Aging, smooth muscle cells and vascular pathobiology: implications for atherosclerosis. Atherosclerosis. 2006;188:221–230. - PubMed
    1. Voelkel NF, Douglas IS, Nicolls M. Angiogenesis in chronic lung disease. Chest. 2007;131:874–879. - PMC - PubMed

Publication types