. 2010 Oct 1;24(19):2146-56.
doi: 10.1101/gad.1968910. Epub 2010 Sep 13.

5'-3'-UTR interactions regulate p53 mRNA translation and provide a target for modulating p53 induction after DNA damage

Affiliations

5'-3'-UTR interactions regulate p53 mRNA translation and provide a target for modulating p53 induction after DNA damage

Jing Chen et al. Genes Dev. .

Abstract

Optimal induction of p53 protein after DNA damage requires RPL26-mediated increases in p53 mRNA translation. We report here the existence of a dsRNA region containing complementary sequences of the 5'- and 3'-untranslated regions (UTRs) of human p53 mRNA that is critical for its translational regulation by RPL26. Mutating as few as 3 bases in either of the two complementary UTR sequences abrogates the ability of RPL26 to bind to p53 mRNA and stimulate p53 translation, while compensatory mutations restore this binding and regulation. Short, single-strand oligonucleotides that target this 5'-3'-UTR base-pairing region blunt the binding of RPL26 to p53 mRNA in cells and reduce p53 induction and p53-mediated cell death after several different types of DNA damage and cellular stress. The ability to reduce stress induction of p53 with oligonucleotides or other small molecules has numerous potential therapeutic uses.


Figures
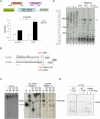
Figure 1.
Figure 1.
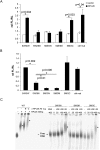
A dsRNA region involving base-pairing of 5′- and 3′-UTR sequences exists in human p53 mRNA. (A) The 3′-UTR sequence is required for optimal RPL26 stimulation of a reporter gene containing the p53 UTRs. MCF-7 cells were transiently transfected with empty vector (vector) or Flag-RPL26 (RPL26) together with firefly luciferase constructs (FL), as illustrated in the schematic diagram, plus a control renilla luciferase expression construct (RL). The relative FL/RL ratio was calculated by normalizing the FL/RL ratio of each sample to the ratio in cells transfected with empty vector (instead of RPL26), renilla luciferase, and the firefly luciferase construct containing a 145-base 5′-UTR and full-length 3′-UTR of human p53. Data shown are average ± SD for three independent experiments. (*) P = 0.004 (Student's t-test). (B) Minimum free energy computational modeling predicts a dsRNA region containing complementary sequences of the 5′- and 3′-UTRs of human p53 mRNA. The schematic diagram shows the sequence and position of these bases in full-length human p53 mRNA, with the start and stop codons underlined, the coding sequence (CDS) noted, and the mutations made in the various constructs used in these studies shown. The detailed information about the mutations introduced into this base pair region is summarized in Supplemental Table 1. (C) The p53 5′-UTR sequence loses its single-strand nature in the presence of the p53 3′-UTR. Wild-type or mutated p53 mRNA containing a 145-base 5′-UTR and coding sequence without (Δ3′) or with (5W/3W) a full-length 3′-UTR was in vitro transcribed, 5′ end-labeled with 32P, and subjected to RNase A (0.1 μg/mL) (lanes 6–9) or RNase T1 (0.1 U/μL) (lanes 10–13) digestion. The digestion products were separated on a 15% UREA-TBE PAGE gel. The arrow indicates cutting at the U(−36) position in the 5′-UTR (109-base product). The arrowhead indicates cutting at the U(−49)/C(−51) position (93/96-base product). (M) A 105-base RNA marker. (Lane 7) 5W/3W; wild-type UTRs. (Lane 8) 5W/3M; wild-type 5′-UTR and 3′-UTR with mutation. (Lane 9) 5M/3W; 5′-UTR with mutation and wild-type 3′-UTR. (D) A 21-base DNA oligonucleotide complementary to the 5′-UTR (5′-AS) is sufficient to restore the double-strand structure at U(−36). (Left panel) p53 mRNA lacking the 3′-UTR and containing a wild-type or mutated 75-base 5′-UTR and a p53 coding sequence was in vitro transcribed, 5′ end-labeled with 32P, and subjected to RNase A digestion (0.1 μg/mL). The arrow indicates cutting at the U(−36) position in the 5′-UTR. (WT) Wild-type 5′-UTR; (mutant) 5′-UTR with mutation. 3′ctrl1 is a control oligonucleotide complementary to a 5′-UTR sequence outside of the predicted interactive region (−74 to −53). The digestion products were separated on a 15% UREA-TBE PAGE gel. (E) The p53 3′-UTR sequence promotes a dsRNA structure in the p53 5′-UTR. Wild-type p53 mRNA containing a 145-base 5′-UTR and coding sequence without (−) or with (+) a full-length 3′-UTR were in vitro transcribed and subjected to RNase V1 digestion (0.1 U/μL) followed by reverse transcription (primer extension). RNase V1 was diluted 10-fold (0.01 U/μL) or 14-fold (0.007 U/μL). Sequencing (lanes 1–4) and cleavage/primer extension reactions (lanes 5–10) were performed with an oligonucleotide primer complementary to the p53 coding sequence close to the 3′ end of the ATG start codon (+2 to +24) (see Supplemental Table 2 for sequence). Sequencing reaction products and primer extension products were separated on a 15% Urea-TBE PAGE gel. The arrow indicates the full-length extension product (FL). The asterisk indicates a cleavage product created by cutting within the predicted dsRNA region (seen only with limited digestion), and the arrowhead indicates a cleavage product generated by cutting out the entire predicted dsRNA structure, both seen only in the presence of the 3′-UTR. The open bracket shows the location and the sequence of the 5′-UTR strand of the putative base-pairing region.
Figure 2.
Figure 2.
The last 3 bp in the putative 5′, 3′-UTR dsRNA structure are required for optimal RPL26 stimulation of p53 translation. (A) Mutations inside the UTR-interacting region modulate p53 reporter gene induction by RPL26. Mutations (as indicated in Fig. 1B; Supplemental Table 1) were introduced into the 5′-UTR (5M/3W), 3′-UTR (5W/3M), or both (5M/3M), including a compensatory mutation (5M/3C) that restores complementarity or an identical 5′-UTR control mutation (ctrl mut) upstream (−64 to −62) of the UTR-interacting region. The dual-luciferase reporter assay was performed as in Figure 1A. Data shown are average ± SD for three independent experiments. P-values were calculated using Student's t-test. (B) Mutations inside the UTR-interacting region affect binding of RPL26 protein to human p53 mRNA in cells. In vitro transcribed wild-type or mutated p53 mRNAs with 5′ cap and 3′ polyadenylation modifications were transfected into H1299 cells. Endogenous RPL26 was immunoprecipitated 16 h post-transfection and the bound p53 mRNA was measured by real-time RT–PCR. The bar graphs show the ratio of the bound p53 mRNA level compared with that seen in cells with wild-type p53 mRNA. The error bars represent average ± SD for three experiments. P-values were calculated using Student's t-test. (C) Mutations in the UTR-interacting region affect the binding of RPL26 protein to human p53 mRNA in vitro. RNA-EMSA was performed to detect the binding of recombinant RPL26 protein (amino acids 45–145) to in vitro transcribed, 5′ end 32P-labeled wild-type or mutated p53 mRNA with a 145-base 5′-UTR and full-length 3′-UTR. In the left panel, an antibody raised against the N terminus (N) or C terminus (C) of RPL26 protein was used for supershift. Asterisks indicate the positions of mobility retarded protein–RNA complexes.
Figure 3.
Figure 3.
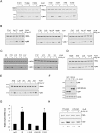
DNA oligonucleotides targeting the UTR-interacting region inhibit p53 induction and RPL26 binding. (A) DNA oligonucleotides complementary to either the 5′- or 3′-UTR-interacting regions block p53 induction. MCF-7 cells were transfected with the indicated amounts of 21-base oligonucleotides using Lipofectamine RNAi MAX or Lipofectamine 2000 (Invitrogen). Oligonucleotides were complementary to the interacting sequences of the 3′-UTR (5′oligo), the 5′-UTR (5′-AS), or UTR sequences from nearby surrounding regions (5′ or 3′ ctrl1 or ctrl2). Twenty-four hours post-transfection, MCF-7 cells were irradiated (0 or 5 Gy IR), harvested 30 min later, and immunoblotted for p53 and NCL proteins. (B) A 15-base fragment of the 21-base 5′oligo is sufficient to block p53 induction by IR. p53 induction 30 min after 5 Gy IR was assessed in MCF-7 cells transfected with various oligonucleotides as described in A. (5′oligo) 21-nt 5′-UTR-interacting sequence; (F18) the first 18 bases of the 21-nt 5′oligo; (L18) the last 18 bases of the 21-nt 5′oligo; (F15) the first 15 bases of L18; (L15) the last 15 bases of L18. Luc21, luc18, and luc15 were oligonucleotides of the luciferase coding sequence with indicated length. (C) Small DNA oligonucleotides can block IR induction of p53. MCF-7 cells were transfected with shorter oligonucleotides generated by serial deletion of L15 from the 5′ end (L12, L9, L8, and L7) for 24 h. p53 induction was assessed in transfected cells 30 min after 5 Gy IR. Oligonucleotides (F12 and F9) generated by deletion from the 3′ end of F15 were used as controls. (D) L15 can enter cells and block p53 induction in the absence of transfection. Oligonucleotides (40 μM) were incubated with MCF-7 cells for 24 h prior to 0 or 5 Gy IR and p53 induction was assessed after 30 min. (E) Point mutations in L15 abolish its blocking effect on p53 induction. p53 induction was assessed 24 h after addition of F15, L15, or mutated L15 to MCF-7 cultures and 30 min after 0 or 5 Gy IR. The sequences of L15, m1, m2, and m3 are GACACGCTTCCCTGG, TTTACGCTTCCCTGG, GACACAACCAACTGG, and GACACGCTTCCCAAA, respectively. (F) L15 blocks RPL26 induction of p53. GFP and GFP-RPL26 were transfected into MCF-7 cells and L15 was added to the medium where indicated 6 h later. p53 levels were assessed 24 h post-transfection. (G) L15 blocks the binding of RPL26 to p53 mRNA in irradiated cells. Thirty minutes after 10 Gy IR, endogenous RPL26 was immunoprecipitated from MCF-7 cells that had been transfected with 40 μM of the indicated oligonucleotide 24 h earlier. p53 mRNA bound to RPL26 was quantified by real-time RT–PCR. The bar graphs show the ratio of the p53 mRNA level to that in untreated cells. The error bars represent average ± SD for three experiments. (*) P = 0.01 (Student's t-test). (H) The LNA-modified L15 (L15-LNA) DNA oligonucleotide inhibits p53 induction. p53 induction 30 min after 5 Gy IR was assessed in MCF-7 cells transfected with L15-LNA. LNA-modified F15 (F15-LNA) is used as a control. Fold increase of p53 protein level is shown below the blot. The band intensity of p53 in each lane was quantified using Image J and normalized to the band intensity of NCL and then compared with the F15-LNA transfected, no-IR-treated lane (first lane).
Figure 4.
Figure 4.
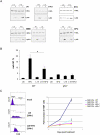
Oligonucleotides targeting the UTR-interacting region are small molecules that can modulate stress induction of p53 and resultant cellular effects in cells. (A, top left) 5′-UTR DNA oligonucleotides block p53 induction following many types of stress. MCF-7 cells were transfected with 40 μM L15 20 h before exposure to 5 J/m2 UV, and p53 induction was assessed 3 h later. MCF-7 or HCT116 cells were transfected with L15 or L8 for 4 h before administration of 100 μM 5-FU (HCT116WT), 170 μM etoposide (ETO) (HCT116WT), 250 μM DFO (MCF-7), or 50 ng/mL methylmethanesulfonate (MMS) (MCF-7) for an additional 20 h, 48 h, 20 h, or 4 h of incubation, respectively, and p53 induction was assessed by immunoblot. The control oligonucleotide shown is F15 or F8. (B) L15 attenuates p53-dependent cell death. p53 wild-type (WT) or p53-null (p53−/−) HCT116 cells were incubated with 40 μM L15 for 4 h before administration of 100 μM 5-FU for an additional 20 h of incubation. Untreated (WT and p53−/−) and treated (WT + L15 and p53−/− + L15) cells were subjected to PI staining. The subG1 cell population was counted and plotted. Data shown are average ± SD for three independent experiments. (*) P = 0.018 (WT vs. WT + L15, Student's t-test). (C) L15 provides a p53-dependent selection advantage for cells following DNA damage. p53 wild-type (WT) or p53-null (p53−/−) HCT116 cells were transfected with 20 μM fluorescein-conjugated L15 or F15 (FAM-L15 and FAM-F15) 4 h before administration of 170 μM etoposide (ETO), and viable cells (PI-negative) were assessed by FACS analysis 1 or 2 d later. The percentage of FAM+ viable cells was assessed at each time point and treatment condition and normalized to the percentage of FAM+ cells prior to etoposide treatment. The right panel shows the fold increase of FAM+ viable cells in etoposide-treated samples compared with untreated samples. Data shown are average ± SD for three independent experiments. A representative FACS analysis (L15 and WT, 24 h) is shown in the left panel.

Comment in

  • Building p53.
    Terzian T, Lozano G. Terzian T, et al. Genes Dev. 2010 Oct 15;24(20):2229-32. doi: 10.1101/gad.1988510. Genes Dev. 2010. PMID: 20952532 Free PMC article.

Similar articles

Cited by

References

    1. Amrani N, Ghosh S, Mangus DA, Jacobson A 2008. Translation factors promote the formation of two states of the closed-loop mRNP. Nature 453: 1276–1280 - PMC - PubMed
    1. Ashcroft M, Vousden KH 1999. Regulation of p53 stability. Oncogene 18: 7637–7643 - PubMed
    1. Edgil D, Harris E 2006. End-to-end communication in the modulation of translation by mammalian RNA viruses. Virus Res 119: 43–51 - PMC - PubMed
    1. Franch T, Gultyaev AP, Gerdes K 1997. Programmed cell death by hok/sok of plasmid R1: Processing at the hok mRNA 3′-end triggers structural rearrangements that allow translation and antisense RNA binding. J Mol Biol 273: 38–51 - PubMed
    1. Fu L, Benchimol S 1997. Participation of the human p53 3′UTR in translational repression and activation following γ-irradiation. EMBO J 16: 4117–4125 - PMC - PubMed

Publication types

MeSH terms