. 2010 Sep 6;190(5):867-79.
doi: 10.1083/jcb.200911036.

microRNA-1 and microRNA-206 regulate skeletal muscle satellite cell proliferation and differentiation by repressing Pax7

Affiliations

microRNA-1 and microRNA-206 regulate skeletal muscle satellite cell proliferation and differentiation by repressing Pax7

Jian-Fu Chen et al. J Cell Biol. .

Abstract

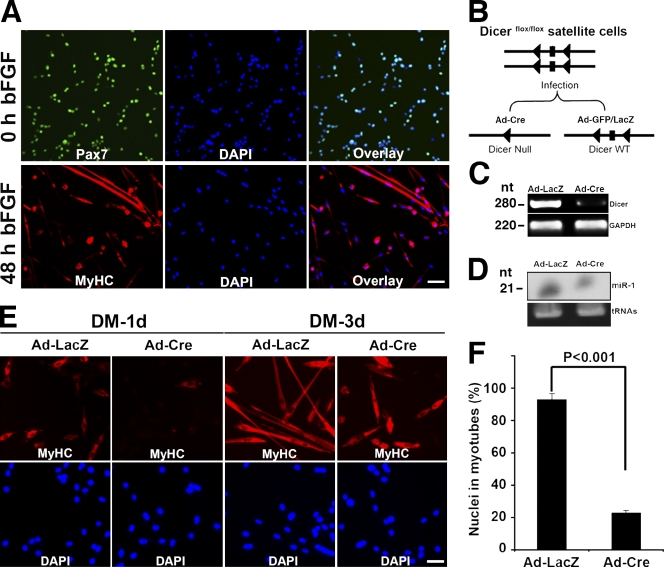
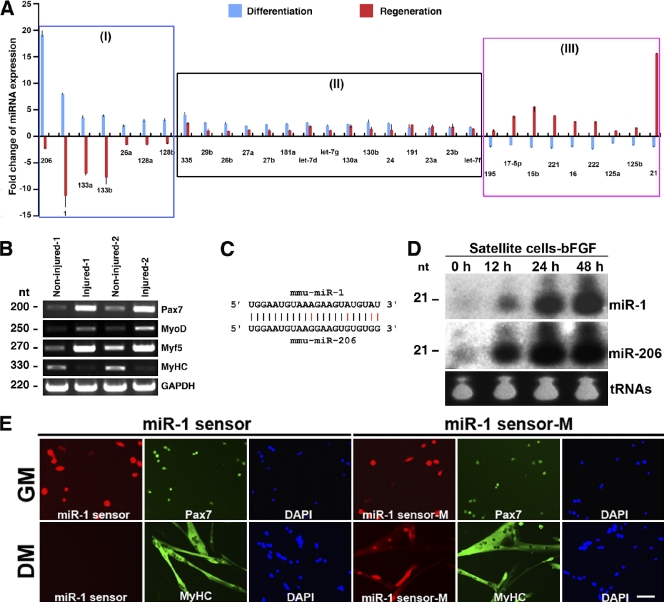
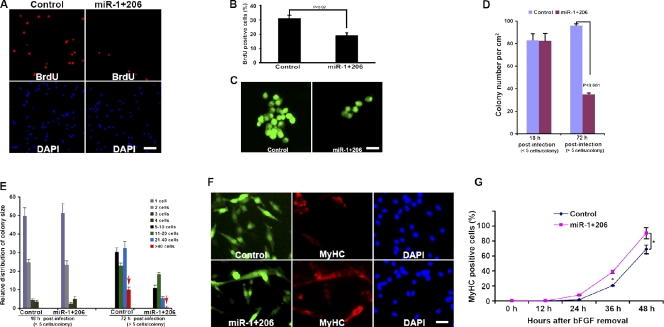
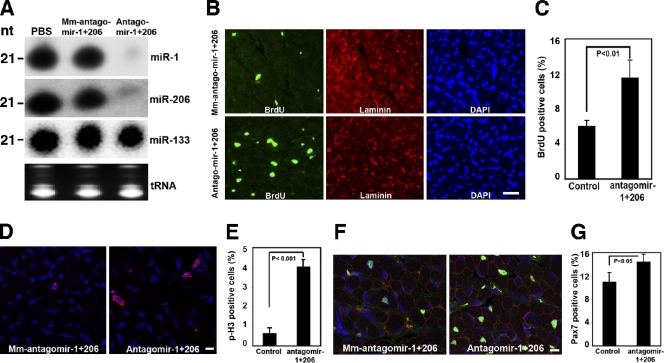
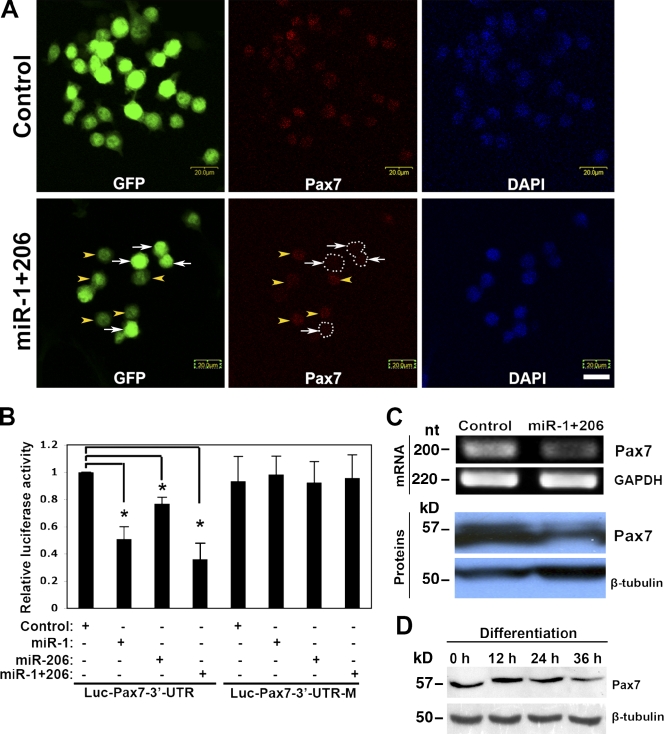
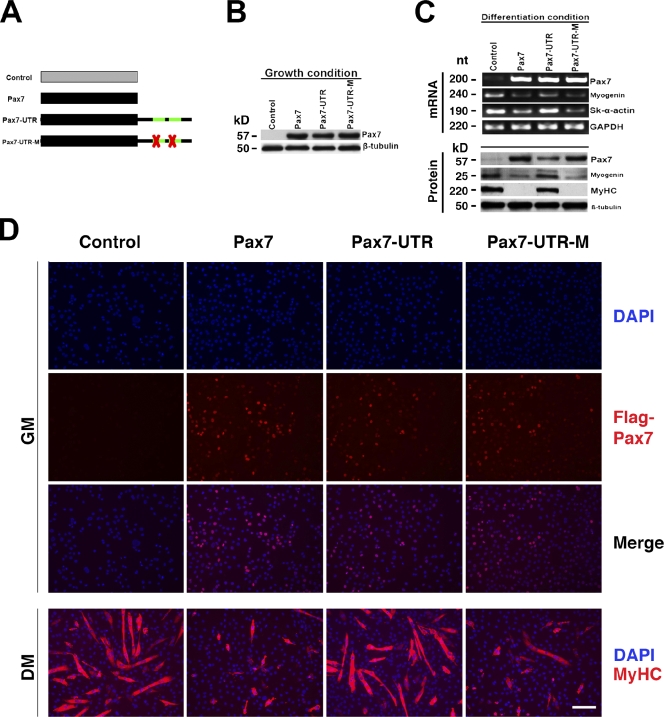
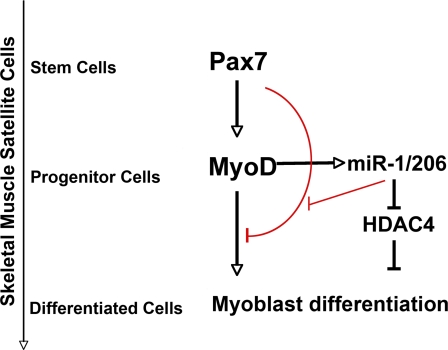
Skeletal muscle satellite cells are adult stem cells responsible for postnatal skeletal muscle growth and regeneration. Paired-box transcription factor Pax7 plays a central role in satellite cell survival, self-renewal, and proliferation. However, how Pax7 is regulated during the transition from proliferating satellite cells to differentiating myogenic progenitor cells is largely unknown. In this study, we find that miR-1 and miR-206 are sharply up-regulated during satellite cell differentiation and down-regulated after muscle injury. We show that miR-1 and miR-206 facilitate satellite cell differentiation by restricting their proliferative potential. We identify Pax7 as one of the direct regulatory targets of miR-1 and miR-206. Inhibition of miR-1 and miR-206 substantially enhances satellite cell proliferation and increases Pax7 protein level in vivo. Conversely, sustained Pax7 expression as a result of the loss of miR-1 and miR-206 repression elements at its 3' untranslated region significantly inhibits myoblast differentiation. Therefore, our experiments suggest that microRNAs participate in a regulatory circuit that allows rapid gene program transitions from proliferation to differentiation.


Figures

Figure 1.
Figure 1.
miRNAs are required for skeletal muscle satellite cell differentiation in vitro. (A) Isolation and differentiation induction of satellite cells. Satellite cells under growth (0 h bFGF) or differentiation condition (48 h bFGF) were fixed and stained with antibodies against Pax7 or MyHC. DAPI-stained nuclei. Bars, 40 µm. (B) Scheme for the generation of Dicer-null satellite cells. LoxP sites (triangles) allow the deletion of Dicer after the infection of an adenoviral vector expressing Cre recombinase (Ad-Cre). Adenovirus-expressing GFP (Ad-GFP) or LacZ (Ad-LacZ) served as the control. WT, wild type. (C) RT-PCR analyses of Dicer expression using RNAs isolated from Ad-Cre or Ad-LacZ–infected Dicerflox/flox satellite cells at 48 h after infection and differentiation induction in DM. GAPDH was used as a loading control. (D) Northern blot analyses of miR-1 expression using the same set of RNAs as C. tRNAs were used as a loading control. (E) Satellite cells infected with Ad-LacZ or Ad-Cre were switched into DM for 1 (DM-1d) or 3 d (DM-3d), and myogenic differentiation was detected by immunostaining for MyHC. DAPI-stained nuclei. Bars, 20 µm. (F) Quantification of fusion event of myoblasts infected with Ad-LacZ or Ad-Cre at 3 d in DM. The fusion index is calculated as the percentage of nuclei in fused myotubes out of the total nuclei for each microscopic field. Myotubes with two or more nuclei were defined as fused myotubes. nt, nucleotide. Error bars indicate SEM of 10 microscopic fields from three independent experiments.
Figure 2.
Figure 2.
miRNA expression pattern during satellite cell differentiation and adult skeletal muscle regeneration. (A) Microarray analyses of miRNA expression in differentiating satellite cells or regenerating skeletal muscle. Bar graph indicates the fold change in miRNA expression during satellite cell differentiation and muscle regeneration compared with their respective controls. Group I represents miRNAs induced in differentiating satellite cells and repressed in regenerating muscle. Group II miRNAs are moderately induced in both differentiating satellite cells and regenerating muscle. miRNAs in group III are repressed in differentiating satellite cells and induced in regenerating muscle. Data represent two independent experiments in triplicate. P < 0.05. (B) RT-PCR analyses of RNAs isolated from noninjured or injured skeletal muscle for the indicated genes. GAPDH served as a loading control. (C) Alignment of mouse miR-1 and miR-206 sequences. (D) Northern blot analyses of miR-1 and miR-206 expression using RNAs isolated from satellite cells at different time points of differentiation induction. tRNAs were used as a loading control. (E) Immunofluorescence of satellite cells expressing a sensor construct containing the miR-1 complementary site (miR-1 sensor) or the mutated miR-1 complementary site (miR-1 sensor M) in GM or DM for 72 h. Note that the expression of miR-1 was inversely correlated with dsRed. miR-1 sensor, but not the mutant miR-1 sensor, was completely silenced in the differentiation condition in which miR-1 was highly expressed. Satellite cell identity and their differentiation status were confirmed by the expression of Pax7 and MyHC, respectively. DAPI-counterstained nuclei. nt, nucleotide. Bar, 40 µm.
Figure 3.
Figure 3.
miR-1 and miR-206 restrict the proliferative potential of satellite cells and enhance their differentiation. (A) Satellite cells were infected with either Ad–miR-1+206 or Ad-GFP (control) and pulsed with 10 µM BrdU for 1.5 h. 12 h later, cell proliferation was determined by immunostaining using antibody against BrdU (red). DAPI-counterstained nuclei. Bar, 40 µm. (B) Quantification of BrdU labeling experiments. The BrdU-positive cells percentage was calculated as the percentage of BrdU-positive cells out of total number of cells indicated by DAPI-positive staining for each microscopic field. P < 0.02. Error bars indicate SEM of 10 microscopic fields from three independent experiments. (C) Satellite cell colony formation assays. Satellite cells were infected with retroviral vectors expressing miR-1 and miR-206 (miR-1+206) or mutated miR-1 and miR-206 (control) and colony size determined. Note the small size of colony expressing miR-1 and miR-206 (miR-1+206) compared with controls 72 h after retroviral infection. Bar, 20 µm. (D and E) Quantification of satellite cell colony formation assay results. The colony numbers (D) and the distribution of different colony size (E) were measured 18 and 72 h after retroviral vector infection. For colony size measurement at 72 h, only colonies containing more than five cells were counted. Data represent the mean ± SD from two independent experiments. (E) Red arrows indicate colonies that contain >40 cells. (F) Satellite cells infected with retroviral vector expressing miR-1+206 or GFP (control) were switched to DM for 48 h, and myogenic differentiation was determined by immunostaining for MyHC. Green, infected cells; red, MyHC. DAPI (blue)-counterstained nuclei. Bar, 20 µm. (G) Quantification of satellite cell differentiation at different time points after miR-1+206 overexpression. Data represent the mean ± SD from three independent experiments. *, P < 0.05.
Figure 4.
Figure 4.
Knockdown of miR-1 and miR-206 increases the proliferation of satellite cells in vivo. (A) Northern blot analyses of total RNAs isolated from skeletal muscle 24 h after the last injection of RNA antagomirs against miR-1 and miR-206 (antagomir-1+206). Muscle injected with PBS or mutated miR-1 and miR-206 antagomirs (mut–antagomir-1+206) were used as controls. tRNAs were used as a loading control. nt, nucleotide. (B) Confocal microscopic images of skeletal muscle 4 h after BrdU labeling from postnatal mice treated with antagomir-1+206 or mut–antagomir-1+206 (serves as a control). Cell proliferation was determined by anti-BrdU antibody (green), laminin (red)-marked cell surface, and DAPI (blue)-counterstained nuclei. Bar, 20 µm. (C) Quantitative measurement of BrdU-positive cells from experiments in B. The BrdU-positive cells percentage was calculated as the percentage of BrdU-positive cells out of the total number of cells indicated by DAPI-positive staining for each microscopic field. Error bars indicate SEM of 10 microscopic fields from three independent experiments. P < 0.01. (D) Confocal microscopic images of skeletal muscle from mice treated with antagomir-1+206 or mut–antagomir-1+206 (controls). Anti-phospho–histone H3 antibody (red) visualized mitotic cells. DAPI (blue)-counterstained nuclei. Bar, 10 µm. (E) Quantitative measurement of phospho–histone H3 (p-H3)-positive cells from experiments in D. The phospho–histone H3-positive cells percentage was calculated as the percentage of phospho–histone H3-positive cells out of the total number of cells indicated by DAPI-positive staining for each microscopic field. Error bars indicate SEM of 10 microscopic fields from three independent experiments. P < 0.001. (F) Merged confocal microscopic images of skeletal muscle from antagomir-1+206 or mut–antagomir-1+206–treated mice. Anti-Pax7 antibody–labeled satellite cells (green). Laminin (red)-outlined cell surface and DAPI (blue)-counterstained nuclei. Bar, 10 µm. (G) Quantitative measurement of Pax7-positive cells from experiments in F. The Pax7-positive cells percentage was calculated as the percentage of Pax7-positive cells out of the total number of cells indicated by DAPI-positive staining for each microscopic field. Error bars indicate SEM of 10 microscopic fields from three independent experiments. P < 0.05.
Figure 5.
Figure 5.
Pax7 is a direct regulatory target of miR-1 and miR-206. (A) Confocal microscopic images of satellite cell colonies infected with retroviral vector expressing GFP–miR-1 and miR-206 or control (GFP only). Note that the expression of Pax7 is inversely correlated with the expression of miR-1+206 (arrows and arrowheads) but not in the control. DAPI-counterstained nuclei. Dotted areas indicate satellite cells with high expression levels of miR-1 and miR-206. Bars, 20 µm. (B) Repression of Pax7 3′-UTR by miR-1 and miR-206. Luciferase reporters were linked with Pax7 3′-UTRs containing either putative miR-1/miR-206–binding sites (Luc-Pax7-3′-UTR) or mutated miR-1– and miR-206–binding sites (Luc-Pax7-3′-UTR–M). miR-1, miR-206, or miR-1+206 plasmids were cotransfected with luciferase-UTR constructs, and luciferase activity was determined. miR-208 (control) was used to serve as a control for the specificity of miRNA. Data represent the mean ± SD from three independent experiments. *, P < 0.05. (C) RT-PCR (top) and Western blot (bottom) analyses of Pax7 mRNA and protein expression in satellite cells infected with retroviral vectors expressing miR-1+206 or a control GFP. GAPDH and β-tubulin served as controls for loading. nt, nucleotide. (D) Western blot analyses of Pax7 protein expression in satellite cells after being switched to the differentiation condition at the indicated time points. β-Tubulin served as a loading control.
Figure 6.
Figure 6.
Functional significance of miR-1– and miR-206–mediated repression of Pax7 during myoblast differentiation. (A) Scheme of expression constructs including a control plasmid, Pax7 ORF only (Pax7), Pax7 with its 3′-UTR containing two miR-1– and miR-206–binding sites (Pax7-UTR), or with the two miR-1– and miR-206–binding sites mutated (Pax7-UTR–M). (B) Western blot analyses of Pax7 protein expression in skeletal muscle C2C12 myoblasts stably transfected with control, Pax7, Pax7-UTR, or Pax7-UTR–M expression constructs under growth condition. β-Tubulin served as a loading control. (C) Expression of Pax7 and other myogenic markers in skeletal muscle C2C12 myoblasts stably transfected with control, Pax7, Pax7-UTR, or Pax7-UTR–M expression constructs under a differentiation condition (36 h after switched to DM). (top) RT-PCR analyses using the indicated primers. GAPDH served as a loading control. (bottom) Western blot analyses using antibodies for Pax7, myogenin, and MyHC. β-Tubulin served as a loading control. nt, nucleotide. (D) Immunofluorescence of skeletal muscle C2C12 myoblasts stably transfected with the indicated Pax7 expression constructs (or control). Cells were either maintained in GM or switched to DM for an additional 48 h. The cells were stained with antibodies against MyHC or anti-Flag antibody for Pax7 expression. DAPI-counterstained nuclei. Bar, 40 µm.
Figure 7.
Figure 7.
Model of miR-1– and miR-206–mediated repression of Pax7 for satellite cell differentiation. Pax7 has multiple functions in satellite cell fate determination. One such role is to specify satellite cells into myogenic fate while preventing their precocious differentiation. Upon the initiation of myogenic differentiation, satellite cell–derived myogenic progenitor cells will start to express myogenic transcription factors, including MyoD, which, in turn, will activate the expression of miR-1 and miR-206. miR-1 and miR-206 potently enhance the myogenic program by limiting and refining the expression of Pax7 in myogenic progenitor cells and myoblasts in addition to repressing HDAC4 (Chen et al., 2006), thereby conferring robustness to the gene program switch from proliferation to differentiation.

Similar articles

Cited by

References

    1. Bernstein E., Caudy A.A., Hammond S.M., Hannon G.J. 2001. Role for a bidentate ribonuclease in the initiation step of RNA interference. Nature. 409:363–366 10.1038/35053110 - DOI - PubMed
    1. Bernstein E., Kim S.Y., Carmell M.A., Murchison E.P., Alcorn H., Li M.Z., Mills A.A., Elledge S.J., Anderson K.V., Hannon G.J. 2003. Dicer is essential for mouse development. Nat. Genet. 35:215–217 10.1038/ng1253 - DOI - PubMed
    1. Buckingham M. 2007. Skeletal muscle progenitor cells and the role of Pax genes. C. R. Biol. 330:530–533 10.1016/j.crvi.2007.03.015 - DOI - PubMed
    1. Callis T.E., Wang D.Z. 2008. Taking microRNAs to heart. Trends Mol. Med. 14:254–260 10.1016/j.molmed.2008.03.006 - DOI - PubMed
    1. Chen J.F., Mandel E.M., Thomson J.M., Wu Q., Callis T.E., Hammond S.M., Conlon F.L., Wang D.Z. 2006. The role of microRNA-1 and microRNA-133 in skeletal muscle proliferation and differentiation. Nat. Genet. 38:228–233 10.1038/ng1725 - DOI - PMC - PubMed

Publication types

MeSH terms