De novo identification and biophysical characterization of transcription-factor binding sites with microfluidic affinity analysis
- PMID: 20802496
- PMCID: PMC2937095
- DOI: 10.1038/nbt.1675
De novo identification and biophysical characterization of transcription-factor binding sites with microfluidic affinity analysis
Abstract
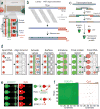
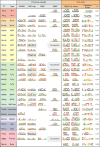
Gene expression is regulated in part by protein transcription factors that bind target regulatory DNA sequences. Predicting DNA binding sites and affinities from transcription factor sequence or structure is difficult; therefore, experimental data are required to link transcription factors to target sequences. We present a microfluidics-based approach for de novo discovery and quantitative biophysical characterization of DNA target sequences. We validated our technique by measuring sequence preferences for 28 Saccharomyces cerevisiae transcription factors with a variety of DNA-binding domains, including several that have proven difficult to study by other techniques. For each transcription factor, we measured relative binding affinities to oligonucleotides covering all possible 8-bp DNA sequences to create a comprehensive map of sequence preferences; for four transcription factors, we also determined absolute affinities. We expect that these data and future use of this technique will provide information essential for understanding transcription factor specificity, improving identification of regulatory sites and reconstructing regulatory interactions.
Figures


Similar articles
-
The GCN4 bZIP can bind to noncognate gene regulatory sequences.Biochim Biophys Acta. 2006 Jul;1764(7):1252-9. doi: 10.1016/j.bbapap.2006.04.009. Epub 2006 May 4. Biochim Biophys Acta. 2006. PMID: 16784907 Free PMC article.
-
Comprehensive, high-resolution binding energy landscapes reveal context dependencies of transcription factor binding.Proc Natl Acad Sci U S A. 2018 Apr 17;115(16):E3702-E3711. doi: 10.1073/pnas.1715888115. Epub 2018 Mar 27. Proc Natl Acad Sci U S A. 2018. PMID: 29588420 Free PMC article.
-
Basic leucine zipper transcription factor Hac1 binds DNA in two distinct modes as revealed by microfluidic analyses.Proc Natl Acad Sci U S A. 2012 Nov 6;109(45):E3084-93. doi: 10.1073/pnas.1212457109. Epub 2012 Oct 10. Proc Natl Acad Sci U S A. 2012. PMID: 23054834 Free PMC article.
-
A systems approach to measuring the binding energy landscapes of transcription factors.Science. 2007 Jan 12;315(5809):233-7. doi: 10.1126/science.1131007. Science. 2007. PMID: 17218526
-
Transcriptional networks: reverse-engineering gene regulation on a global scale.Curr Opin Microbiol. 2004 Dec;7(6):638-46. doi: 10.1016/j.mib.2004.10.009. Curr Opin Microbiol. 2004. PMID: 15556037 Review.
Cited by
-
DNA motif elucidation using belief propagation.Nucleic Acids Res. 2013 Sep;41(16):e153. doi: 10.1093/nar/gkt574. Epub 2013 Jun 29. Nucleic Acids Res. 2013. PMID: 23814189 Free PMC article.
-
A force-based, parallel assay for the quantification of protein-DNA interactions.PLoS One. 2014 Feb 27;9(2):e89626. doi: 10.1371/journal.pone.0089626. eCollection 2014. PLoS One. 2014. PMID: 24586920 Free PMC article.
-
Positive and negative design for nonconsensus protein-DNA binding affinity in the vicinity of functional binding sites.Biophys J. 2013 Oct 1;105(7):1653-60. doi: 10.1016/j.bpj.2013.08.033. Biophys J. 2013. PMID: 24094406 Free PMC article.
-
Direct measurement of DNA affinity landscapes on a high-throughput sequencing instrument.Nat Biotechnol. 2011 Jun 26;29(7):659-64. doi: 10.1038/nbt.1882. Nat Biotechnol. 2011. PMID: 21706015 Free PMC article.
-
Msn2 coordinates a stoichiometric gene expression program.Curr Biol. 2013 Dec 2;23(23):2336-45. doi: 10.1016/j.cub.2013.09.043. Epub 2013 Nov 7. Curr Biol. 2013. PMID: 24210615 Free PMC article.
References
-
- Segal E, Raveh-Sadka T, Schroeder M, Unnerstall U, Gaul U. Predicting expression patterns from regulatory sequence in Drosophila segmentation. Nature. 2008;451:535–540. - PubMed
Publication types
MeSH terms
Substances
Associated data
- Actions
Grants and funding
LinkOut - more resources
Full Text Sources
Molecular Biology Databases

