

Tel2 structure and function in the Hsp90-dependent maturation of mTOR and ATR complexes
- PMID: 20801936
- PMCID: PMC2939364
- DOI: 10.1101/gad.1956410
Tel2 structure and function in the Hsp90-dependent maturation of mTOR and ATR complexes
Abstract
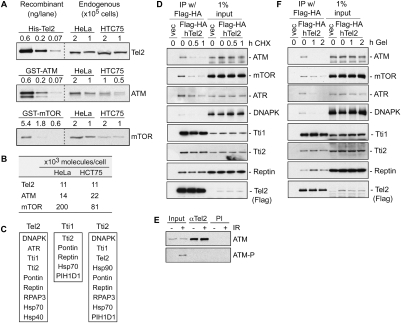
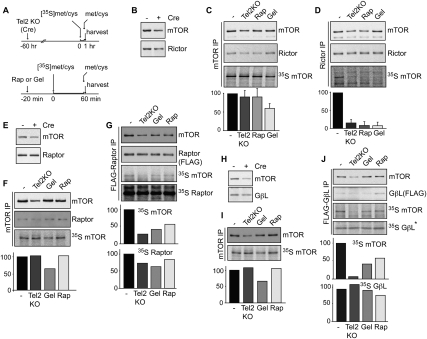
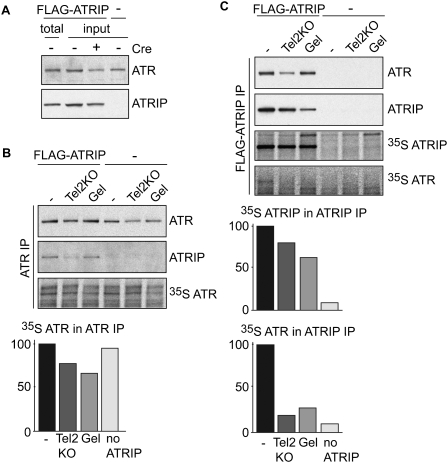
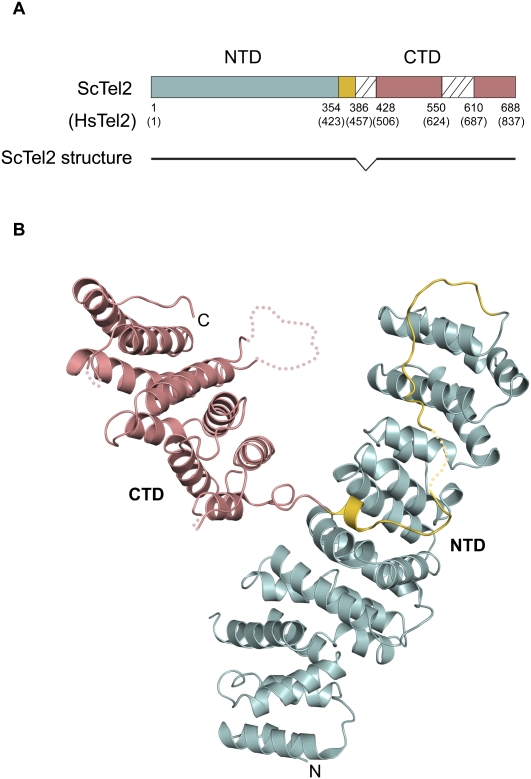
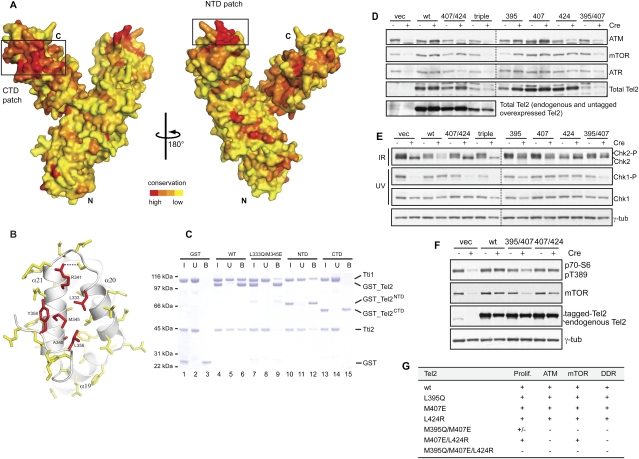
We reported previously that the stability of all mammalian phosphatidylinositol 3-kinase-related protein kinases (PIKKs) depends on their interaction with Tel2, the ortholog of yeast Tel2 and Caenorhabditis elegans Clk-2. Here we provide evidence that Tel2 acts with Hsp90 in the maturation of PIKK complexes. Quantitative immunoblotting showed that the abundance of Tel2 is low compared with the PIKKs, and Tel2 preferentially bound newly synthesized ATM, ATR, mTOR, and DNA-PKcs. Tel2 complexes contained, in addition to Tti1-Tti2, the Hsp90 chaperone, and inhibition of Hsp90 interfered with the interaction of Tel2 with the PIKKs. Analysis of in vivo labeled nascent protein complexes showed that Tel2 and Hsp90 mediate the formation of the mTOR TORC1 and TORC2 complexes and the association of ATR with ATRIP. The structure of yeast Tel2, reported here, shows that Tel2 consists of HEAT-like helical repeats that assemble into two separate α-solenoids. Through mutagenesis, we identify a surface patch of conserved residues involved in binding to the Tti1-Tti2 complex in vitro. In vivo, mutation of this conserved patch affects cell growth, levels of PIKKs, and ATM/ATR-mediated checkpoint signaling, highlighting the importance of Tti1-Tti2 binding to the function of Tel2. Taken together, our data suggest that the Tel2-Tti1-Tti2 complex is a PIKK-specific cochaperone for Hsp90.
Figures
Similar articles
-
Structure of the Human TELO2-TTI1-TTI2 Complex.J Mol Biol. 2022 Jan 30;434(2):167370. doi: 10.1016/j.jmb.2021.167370. Epub 2021 Nov 24. J Mol Biol. 2022. PMID: 34838521
-
CK2 phospho-dependent binding of R2TP complex to TEL2 is essential for mTOR and SMG1 stability.Mol Cell. 2010 Sep 24;39(6):839-50. doi: 10.1016/j.molcel.2010.08.037. Mol Cell. 2010. PMID: 20864032
-
TTT (Tel2-Tti1-Tti2) Complex, the Co-Chaperone of PIKKs and a Potential Target for Cancer Chemotherapy.Int J Mol Sci. 2023 May 5;24(9):8268. doi: 10.3390/ijms24098268. Int J Mol Sci. 2023. PMID: 37175973 Free PMC article. Review.
-
Branching the Tel2 pathway for exact fit on phosphatidylinositol 3-kinase-related kinases.Curr Genet. 2018 Oct;64(5):965-970. doi: 10.1007/s00294-018-0817-9. Epub 2018 Feb 22. Curr Genet. 2018. PMID: 29470645 Free PMC article. Review.
-
A tel2 Mutation That Destabilizes the Tel2-Tti1-Tti2 Complex Eliminates Rad3ATR Kinase Signaling in the DNA Replication Checkpoint and Leads to Telomere Shortening in Fission Yeast.Mol Cell Biol. 2019 Sep 27;39(20):e00175-19. doi: 10.1128/MCB.00175-19. Print 2019 Oct 15. Mol Cell Biol. 2019. PMID: 31332096 Free PMC article.
Cited by
-
Large FK506-binding proteins shape the pharmacology of rapamycin.Mol Cell Biol. 2013 Apr;33(7):1357-67. doi: 10.1128/MCB.00678-12. Epub 2013 Jan 28. Mol Cell Biol. 2013. PMID: 23358420 Free PMC article.
-
Mechanisms of Hsp90 regulation.Biochem J. 2016 Aug 15;473(16):2439-52. doi: 10.1042/BCJ20160005. Biochem J. 2016. PMID: 27515256 Free PMC article. Review.
-
The interaction between RPAP3 and TRBP reveals a possible involvement of the HSP90/R2TP chaperone complex in the regulation of miRNA activity.Nucleic Acids Res. 2022 Feb 28;50(4):2172-2189. doi: 10.1093/nar/gkac086. Nucleic Acids Res. 2022. PMID: 35150569 Free PMC article.
-
Essentiality of Sis1, a J-domain protein Hsp70 cochaperone, can be overcome by Tti1, a specialized PIKK chaperone.Mol Biol Cell. 2022 Mar 1;33(3):br3. doi: 10.1091/mbc.E21-10-0493. Epub 2021 Dec 22. Mol Biol Cell. 2022. PMID: 34935410 Free PMC article.
-
Initiation of Pulmonary Fibrosis after Silica Inhalation in Rats is linked with Dysfunctional Shelterin Complex and DNA Damage Response.Sci Rep. 2019 Jan 24;9(1):471. doi: 10.1038/s41598-018-36712-6. Sci Rep. 2019. PMID: 30679488 Free PMC article.
References
-
- Abraham RT 2004. PI 3-kinase related kinases: ‘Big’ players in stress-induced signaling pathways. DNA Repair (Amst) 3: 883–887 - PubMed
-
- Adami A, Garcia-Alvarez B, Arias-Palomo E, Barford D, Llorca O 2007. Structure of TOR and its complex with KOG1. Mol Cell 27: 509–516 - PubMed
-
- Andrade MA, Perez-Iratxeta C, Ponting CP 2001a. Protein repeats: Structures, functions, and evolution. J Struct Biol 134: 117–131 - PubMed
Publication types
MeSH terms
Substances
Associated data
- Actions
Grants and funding
LinkOut - more resources
Full Text Sources
Other Literature Sources
Molecular Biology Databases
Research Materials
Miscellaneous