. 2010;11(8):R90.
doi: 10.1186/gb-2010-11-8-r90. Epub 2010 Aug 27.

Comprehensive modeling of microRNA targets predicts functional non-conserved and non-canonical sites

Affiliations

Comprehensive modeling of microRNA targets predicts functional non-conserved and non-canonical sites

Doron Betel et al. Genome Biol. 2010.

Abstract

mirSVR is a new machine learning method for ranking microRNA target sites by a down-regulation score. The algorithm trains a regression model on sequence and contextual features extracted from miRanda-predicted target sites. In a large-scale evaluation, miRanda-mirSVR is competitive with other target prediction methods in identifying target genes and predicting the extent of their downregulation at the mRNA or protein levels. Importantly, the method identifies a significant number of experimentally determined non-canonical and non-conserved sites.


Figures

Figure 1
Figure 1
Features used in the mirSVR model. mirSVR uses features derived from the miRanda-predicted miRNA::site duplex, the local context of the candidate site, and the global context of the site in the 3' UTR. Duplex features include a bit representation of base-pairing at the seed region and the extent of 3' binding. Local features include AU composition flanking the target site and secondary structure accessibility score. Global features include length of UTR, relative position of target site from UTR ends, and conservation level of the block containing the target site.
Figure 2
Figure 2
Comparison of mirSVR to other methods. (a) Spearman rank correlation (vertical bars) between prediction and observation for canonical seed targets as ranked by mirSVR score, context score, alignment score from miRanda and energy score from PITA. Rank correlations were computed between prediction scores and observed log expression changes for 17 test sets measuring mRNA expression changes following microRNA transfection in different cell lines and genetic backgrounds [21] (brown), five test sets measuring protein expression changes following microRNA transfection [17] (red), and three test sets measuring mRNA expression changes following microRNA inhibition [21,23,41] (orange). Ranking by mirSVR scores outperforms that by context scores in 21 out of the 25 test sets. (b) ROC curves (receiver operating characteristic) for mirSVR score versus context score for ranking the top 20% most downregulated targets (defined as true positives) and 20% of least downregulated targets (defined as true negatives) for the miR-192 transfection [21]. Shown here are the ROC curves up to 30% false positive detection. In this example, in the range shown, for a given false positive rate, mirSVR ranking yields an advantage of up to 10 percentage points in the rate of true positive prediction. (c) A summary of this ROC analysis over the 25 test sets, computing the area under the ROC curve (AUC) for mirSVR and context score and reporting the difference in performance (mirSVR AUC - context score AUC) for each test set. Overall, mirSVR score shows a statistically significant improvement over context score with a mean AUC of 0.80 as compared to 0.78 and outperforming context score in 19 (bars above the zero line) out of the 25 test sets (P-value < 0.006, signed rank test).
Figure 3
Figure 3
Role of conservation in target prediction. (a) Empirical cumulative distribution of log expression changes of genes with single canonical sites for miR-15a, filtered by increasing conservation thresholds. Distributions of more conserved sites display a subtle shift towards negative values indicating a slight increase in downregulation of target genes. (b) Detection rate of miR-15a targets defined as genes with a single canonical miR-15a site that are in the top 5% most downregulated genes (443 genes). Under increasing conservation thresholds, the detection rate of the most downregulated miR-15a targets drops substantially, showing loss of detection of genes with effective but non-conserved sites. Detection rates were scaled by the maximum number of miR-15a targets identified in the top 5% most downregulated genes without conservation filtering (red line).
Figure 4
Figure 4
Correlation of mirSVR scores with log expression change for genes with single canonical (green) and non-canonical sites (blue). mirSVR scores are divided into equal size bins (percentile) and the mean and standard deviation of the corresponding log expression changes are plotted for each bin. (a) Before sigmoid transformation, the mirSVR scores have non-linear correlation with the mean (Z-transformed) observed log expression change of the genes. Canonical target sites are generally more effective sites than non-canonical sites as shown by their more negative mirSVR scores and corresponding log expression change. Where scores for non-canonical sites fall in the same range as canonical sites, the corresponding mean expression change also fall in the same range, indicating that non-canonical and canonical sites with comparable scores inhibit their targets with similar efficiency. (b) After transforming with a sigmoid transfer function (fitted on the training data), mirSVR scores correlate linearly with log expression change and therefore can be used for analysis of target site efficiency; moreover, transformed site scores can be added to score genes with multiple sites.
Figure 5
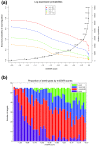
Figure 5
Probability of downregulation and seed class distributions derived from mirSVR score analysis. (a) Empirical probabilities of microRNA-mediated downregulation for different mirSVR scores. Using mirSVR prediction scores on the Linsley et al. data, we compute the empirical probability that a gene's Z-transformed log expression change is below a (a = -0.1, -0.5, -1.0, -1.5), conditioned that its (sigmoid-transformed) mirSVR score is less than a threshold S (x-axis). Points on the plot represent mirSVR score cutoffs S and their corresponding probability P(y a|x S). The black curve represents the fraction of predictions with scores equal to or less than the cutoff scores. For example, 10% of predicted targets have a score of ≤ -0.8 and their expected probability of observing a log expression change of ≤ -0.5 is approximately 40%. (b) The proportion of the four seed classes: 8-mers, 7m8, 7A1 and 6-mer in equal-size mirSVR score bins. The canonical sites from Linsley et al. were divided into equal size bins and the proportion of the four seed classes is shown by color. As expected the score distribution correlates with seed type hierarchy (for example, 8-mers have generally more negative mirSVR scores than 7m8 sites). However, inspection of the top 30% predicted target sites (mirSVR score ≤ -0.1) highlights the broad overlapping distributions of the four seed types, suggesting that the classification of target sites to seed classes is inadequate to represent their relative efficiency.
Figure 6
Figure 6
mirSVR performance on non-canonical sites. (a) A summary of the AUC scores for the Linsley et al. (brown) and Selbach et al. (orange) data sets. ROC analysis was performed on the most downregulated targets with log expression change of Z-score ≤ -1 (true positive) and the least regulated targets with Z-score ≥ 1 (true negative) for all sites, canonical sites only and non-canonical sites only. Note that two experiments were excluded due to low number of false positive and false negative examples. In all but one experiment the AUC values for non-canonical sites are above 0.5, indicating better than random detection. (b) A cumulative distribution function (CDF) plot of the mirSVR scores of the CLIP-identified non-canonical sites (true sites) and all other non-canonical sites predicted in the same 3' UTRs (false sites). The significant shift in the CDF for targets identified by the CLIP method indicates that mirSVR scores can identify a subset of the efficient non-canonical sites.

Similar articles

Cited by

References

    1. Filipowicz W, Bhattacharyya SN, Sonenberg N. Mechanisms of post-transcriptional regulation by microRNAs: are the answers in sight? Nat Rev Genet. 2008;9:102–14. doi: 10.1038/nrg2290. - DOI - PubMed
    1. Lai EC. MicroRNAs are complementary to 3' UTR sequence motifs that mediate negative post-transcriptional regulation. Nat Genet. 2002;30:363–4. doi: 10.1038/ng865. - DOI - PubMed
    1. Didiano D, Hobert O. Perfect seed pairing is not a generally reliable predictor for miRNA-target interactions. Nat Struct Mol Biol. 2006;13:849–51. doi: 10.1038/nsmb1138. - DOI - PubMed
    1. Didiano D, Hobert O. Molecular architecture of a miRNA-regulated 3' UTR. RNA. 2008;14:1297–317. doi: 10.1261/rna.1082708. - DOI - PMC - PubMed
    1. Lal A, Navarro F, Maher CA, Maliszewski LE, Yan N, O'Day E, Chowdhury D, Dykxhoorn DM, Tsai P, Hofmann O, Becker KG, Gorospe M, Hide W, Lieberman J. miR-24 Inhibits cell proliferation by targeting E2F2, MYC, and other cell-cycle genes via binding to "seedless" 3' UTR microRNA recognition elements. Mol Cell. 2009;35:610–25. doi: 10.1016/j.molcel.2009.08.020. - DOI - PMC - PubMed

Publication types

LinkOut - more resources