. 2010 Jul-Aug;15(4):046018.
doi: 10.1117/1.3470241.

Three-dimensional optical method for integrated visualization of mouse islet microstructure and vascular network with subcellular-level resolution

Affiliations

Three-dimensional optical method for integrated visualization of mouse islet microstructure and vascular network with subcellular-level resolution

Ya-Yuan Fu et al. J Biomed Opt. 2010 Jul-Aug.

Abstract

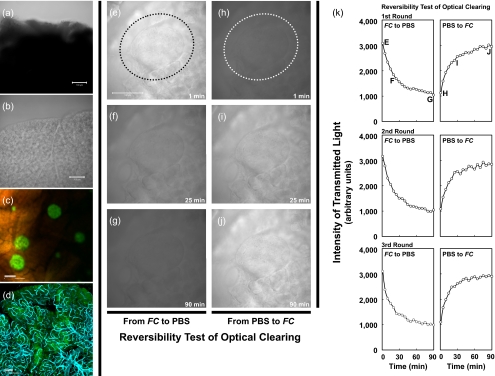
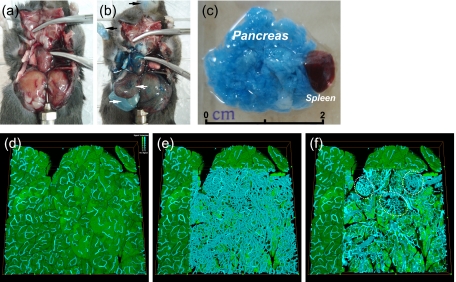
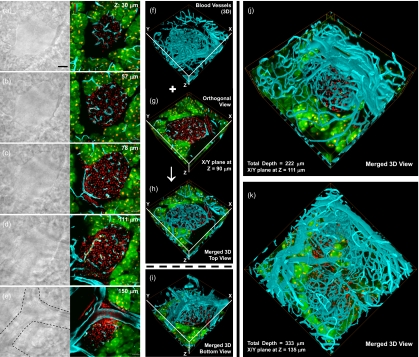
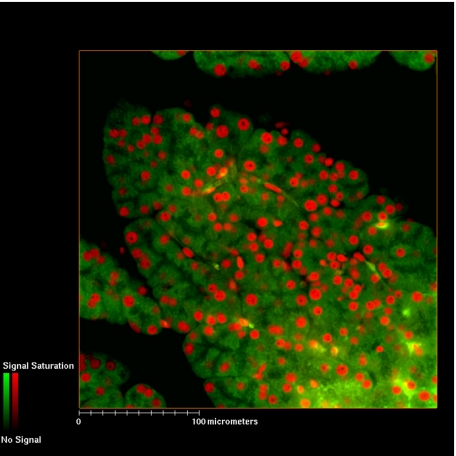
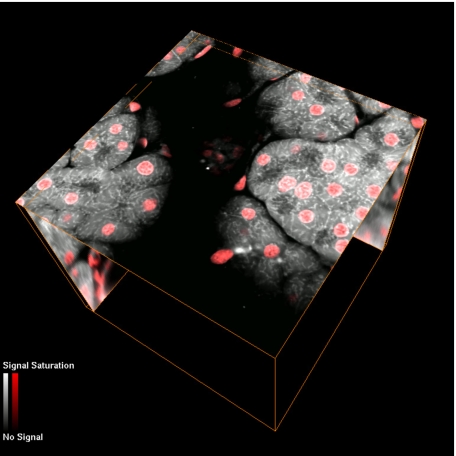
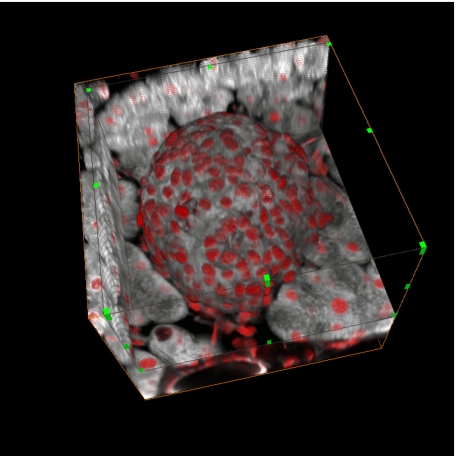
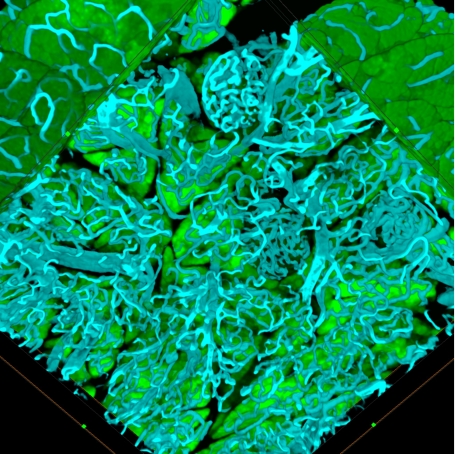
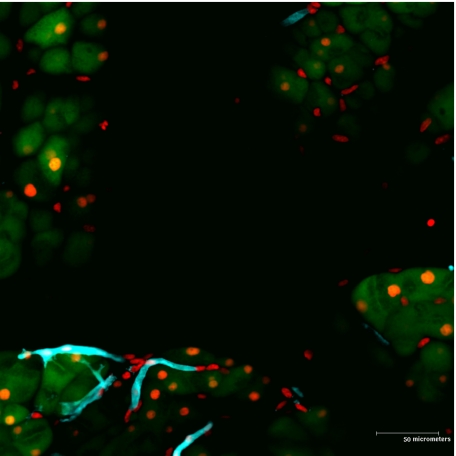
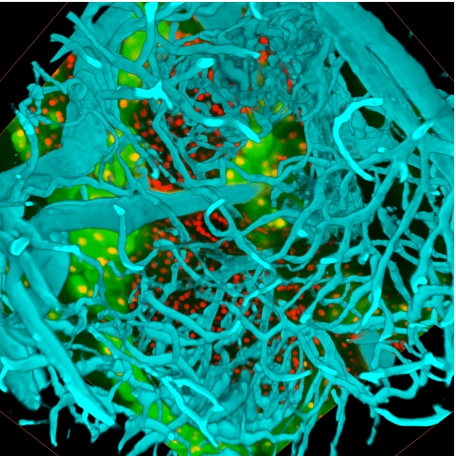
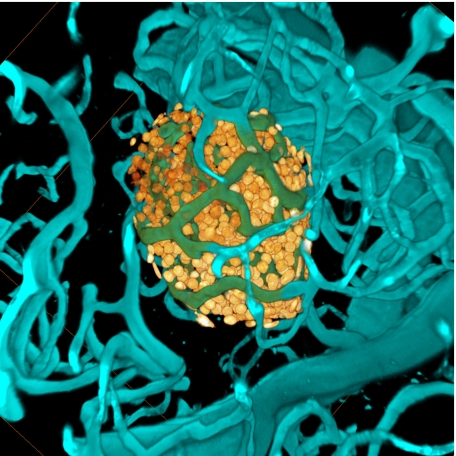
Microscopic visualization of islets of Langerhans under normal and diabetic conditions is essential for understanding the pathophysiology of the disease. The intrinsic opacity of pancreata, however, limits optical accessibility for high-resolution light microscopy of islets in situ. Because the standard microtome-based, 2-D tissue analysis confines visualization of the islet architecture at a specific cut plane, 3-D representation of image data is preferable for islet assessment. We applied optical clearing to minimize the random light scattering in the mouse pancreatic tissue. The optical-cleared pancreas allowed penetrative, 3-D microscopic imaging of the islet microstructure and vasculature. Specifically, the islet vasculature was revealed by vessel painting-lipophilic dye labeling of blood vessels-for confocal microscopy. The voxel-based confocal micrographs were digitally processed with projection algorithms for 3-D visualization. Unlike the microtome-based tissue imaging, this optical method for penetrative imaging of mouse islets yielded clear, continuous optical sections for an integrated visualization of the islet microstructure and vasculature with subcellular-level resolution. We thus provide a useful imaging approach to change our conventional planar view of the islet structure into a 3-D panorama for better understanding of the islet physiology.


Figures

Figure 1
Figure 1
(a) and (b) Optical clearing improves the transparency of the mouse pancreas. The specimens were immersed in phosphate-buffered saline (PBS) (a) or FocusClear solution (b) prior to being imaged by the transmitted light channel of confocal microscopy. (c) and (d) Gross images of islets of Langerhans (revealed by insulin immunostaining) and vasculature (revealed by vessel painting), respectively, in the optical-cleared pancreas. (e) to (j) Reversibility test of the optical clearing effect. The intensity of transmitted light is presented in gray scale. In (e) to (g) and (h) to (j), the immersion solution was changed from FocusClear to PBS and from PBS to FocusClear, respectively. FC: FocusClear. The dotted circle indicates the location of the islet. (k) Kinetics of the optical clearing effect and the reverse of optical clearing. The intensity of transmitted light was measured over time. A similar trend was seen in all three rounds of optical clearing. The letters e to j in the upper panel of (k) correspond to the grayscale micrographs of (e) to (j). The volume ratio of tissue/FocusClear is ∼1∕50. In (a) to (e), bar=100 μm.
Figure 2
Figure 2
Penetrative confocal imaging of islets of Langerhans in the mouse pancreas. (a) to (e) Confocal micrographs at different depths in the pancreatic tissue specimen. (a) and (b) The exocrine acinar tissue. (c) to (e) Islets of Langerhans in association with acinar cells, pancreatic duct (d), and blood vessels. Cells in the specimen were stained by DiD and PI to reveal the cellular membranes (green) and nuclei (red), respectively. Particularly in (e), the elongation of the endothelial cell nuclei along the vessel direction can be clearly identified. Bar=50 μm. The complete serial optical sections, from the surface to depth=330 μm, are shown in Video 1. (f) and (g) Stereo projections of the stack of confocal micrographs showing the two islets [(c) and (e)] embedded in the exocrine acini and linked with blood vessels. The DiD-stained cellular membranes are presented in gray scale for 3-D perspective views. In (f), a cuboid was digitally subtracted from the scanned volume to reveal the islet shown in (c). In (g), a second cuboid was subtracted from (f) to present both of the two islets shown in (c) and (e). (h) A clockwise, 90-deg rotation of (g) was made to create a new viewing angle. Dimensions of the scanned volume: 290 μm (x)×290 μm (y)×330 μm (z, depth). (i) to (k) High-resolution, 3-D projections of an embedded islet in connection with its vascular network. In (i), the dotted circle indicates the location of the embedded islet. In (j), a cuboid was subtracted to expose the capillary (arrows). In (k), the fluorescent signals of the islet were digitally extracted from the original stack of confocal micrographs and then added into (j). Continuous orthogonal views of the islet and a 360-deg panoramic presentation of (k) are shown in Videos 2 and 3, respectively. (Color online only.)
Figure 3
Figure 3
(a) to (c) Use of vessel painting, i.e., lipophilic dye DiD perfusion, to label blood vessels. (a) Prior to vessel painting and (b) post vessel painting of the nestin-GFP transgenic mouse. Arrows in (b) indicate the stained blue tissues/organs after the DiD perfusion. (c) An enlarged view of the harvested mouse pancreas (together with the spleen) after vessel painting. (d) to (f) 3-D gross views of the labeled pancreatic tissue. Signals of GFP expression (green) and DiD-labeled vasculature (cyan) are combined in (d). In (e), a cuboid (depth=125 μm) of GFP signals is subtracted from (d) to reveal the vasculature. In (f), a cuboid (depth=80 μm) of DiD signals is subtracted from (e) to reveal the locations of the three embedded islets, indicated by the white dotted circles. Dimensions of the scanned volume: 1300 μm (x)×1300 μm (y)×250 μm (z, depth). Video 4 provides additional projection angles and zoom-in and zoom-out movements of panels (d) to (f). In the 3-D projections, we added an xy plane at z=125 μm to outline the tissue structure. (Color online only.)
Figure 4
Figure 4
High-resolution, 3-D images of the islet vasculature in the mouse pancreas. (a) to (e) Micrographs of transmitted light (left) and fluorescence (right) imaging at different depths in the pancreatic tissue specimen. The vascular network (cyan) was labeled with lipophilic DiD by cardiac perfusion. PI staining was used to reveal the nuclei (red). We used the pancreas from the nestin-GFP transgenic mice (GFP expression driven by the nestin promoter) to highlight the exocrine acini (green) (Refs. 21, 22) This mouse line shows minimal, if any, GFP expression in the islet endocrine cells. In (e), large blood vessels can be seen in both the transmitted light (dotted lines indicate the approximate boundaries) and the fluorescence micrographs. The complete fluorescent serial optical sections of the imaged islet are shown in Video 5. (f) to (i) Separate and merged stereo projections of the blood vessels and the islet/pancreatic structure. (h) and (i) are projections from the top and bottom halves of the imaged region. A “landmark” pancreatic duct can be seen in (g), at the right side of the islet. The same duct can be seen in (h) and (i), yet some areas were blocked by the projection of blood vessels. Dimensions of the scanned volume: 369 μm (x)×369 μm (y)×225 μm (z, depth). (j) and (k) Representative 3-D projections of the islet vasculature in the mouse pancreas. Video 6 provides additional projection angles and zoom-in and zoom-out movements of panel (k). (Color online only.)
Video 1
Video 1
Complete serial optical sections of the mouse pancreas shown in Figs. 2a, 2b, 2c, 2d, 2e (depth=330 μm). The specimen was stained by DiD and propidium iodide to reveal the cellular membranes (green) and nuclei (red), respectively. Two islets were imaged in the scanned volume at depths of ∼180 μm and ∼270 μm (MPEG 4.9 MB). (Color online only.).
Video 2.
Video 2.
High-resolution, stereo projection of the serial orthogonal views of the islet shown in Figs. 2i, 2j, 2k. The specimen was stained by DiD and propidium iodide to reveal the cellular membranes (gray) and nuclei (red), respectively. Dimensions of the scanned volume: 175 μm (x)×175 μm (y)×122 μm (z, depth) (MPEG 4.9 MB). (Color online only.) .
Video 3.
Video 3.
360-deg panoramic presentation of Fig. 2k. The voxels of the islet shown in Video 2 were digitally collected and merged with the signals shown in Fig. 2j (MPEG 5 MB)..
Video 4.
Video 4.
3-D gross views of the mouse pancreatic vasculature. Lipophilic dye DiD perfusion was used to label blood vessels. The Volume Editing function of the Amira software was used to subtract signals from acini (green) and then vasculature (cyan) at the top corner of the imaged region to expose the interior domain for visualization. Dimensions of the scanned volume: 1300 μm (x)×1300 μm (y)×250 μm (z, depth). An xy plane is shown at z=125 μm to outline the tissue structure (MPEG 4.8 MB). (Color online only.).
Video 5.
Video 5.
High-resolution, serial optical sections of the islet vasculature shown in Figs. 4a, 4b, 4c, 4d, 4e (depth=225 μm). Fluorescent labeling of blood vessels (cyan) was done by cardiac perfusion of DiD, i.e., vessel painting. The pancreas from the nestin-GFP transgenic mouse was used in the imaging, which has strong nestin-GFP expression in the exocrine acinar cells (green). Propidium iodide staining was used to reveal the nuclei (red) (MPEG 5 MB). (Color online only.) .
Video 6.
Video 6.
Fly-through presentation of the islet vasculature shown in Fig. 4k using multiple projection angles and magnifications. The Camera Path function of the Amira software was used to adjust the viewing angles and the zoom-in and zoom-out movements. Dimensions of the scanned volume: 521 μm (x)×521 μm (y)×333 μm (z, depth). Two xy planes are shown at Z=135 and 204 μm to outline the tissue structure. Two islets reside in the scanned volume (MPEG 4.9 MB). .
Video 7.
Video 7.
Fly-through presentation of the vasculature in the interior and exterior domains of an islet. The interior domain of the islet vasculature was assigned to yellow, using the Image Segmentation function of the Amira software and the ovoid islet surface as the segmentation boundary. Dimensions of the scanned volume: 369 μm (x)×369 μm (y)×207 μm (z, depth) (MPEG 5 MB). (Color online only.) .

Similar articles

Cited by

References

    1. Cabrera O., Berman D. M., Kenyon N. S., Ricordi C., Berggrern P. O., and Caicedo A., “The unique cytoarchitecture of human pancreatic islets has implications for islet cell function,” Proc. Natl. Acad. Sci. U.S.A. PNASA6 103(7), 2334–2339 (2006).10.1073/pnas.0510790103 - DOI - PMC - PubMed
    1. Gromada J., Franklin I., and Wollheim C. B., “Alpha-cells of the endocrine pancreas: 35 years of research but the enigma remains,” Endocr. Rev. ERVIDP 28(1), 84–116 (2007).10.1210/er.2006-0007 - DOI - PubMed
    1. Brunicardi F. C., Stagner J., Bonner-Weir S., Wayland H., Kleinman R., Livingston E., Guth P., Menger M., McCuskey R., Intaglietta M., Charles A., Ashley S., Cheung A., Ipp E., Gilman S., Howard T., and Passaro E., “Microcirculation of the islets of Langerhans—Long Beach Veterans Administration Regional Medical Education Center Symposium,” Diabetes DIAEAZ 45(4), 385–392 (1996). - PubMed
    1. Ballian N. and Brunicardi F. C., “Islet vasculature as a regulator of endocrine pancreas function,” World J. Surg. WJSUDI 31(4), 705–714 (2007).10.1007/s00268-006-0719-8 - DOI - PubMed
    1. Tuchin V. V., “A clear vision for laser diagnostics,” IEEE J. Sel. Top. Quantum Electron. IJSQEN 13(6), 1621–1628 (2007).10.1109/JSTQE.2007.911313 - DOI

Publication types

MeSH terms