

HIV-1 assembly differentially alters dynamics and partitioning of tetraspanins and raft components
- PMID: 20727121
- PMCID: PMC4073295
- DOI: 10.1111/j.1600-0854.2010.01111.x
HIV-1 assembly differentially alters dynamics and partitioning of tetraspanins and raft components
Abstract
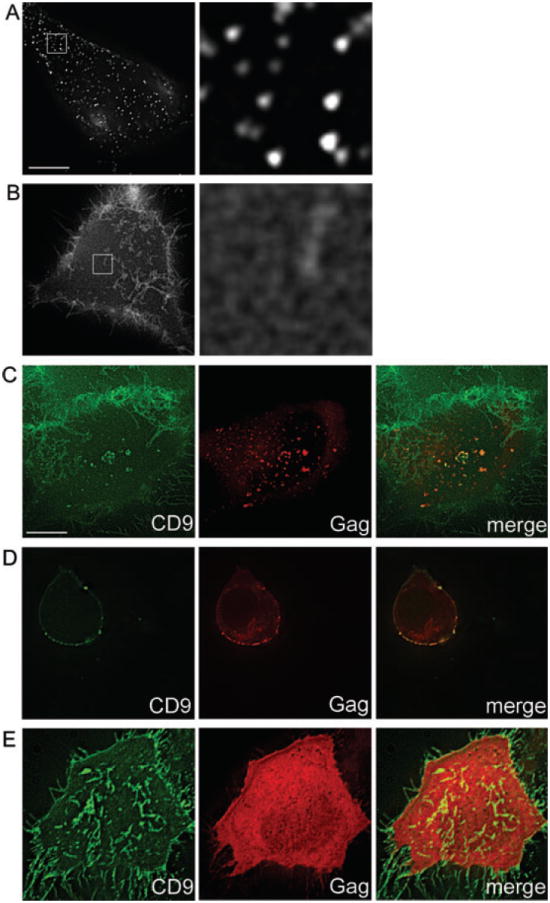
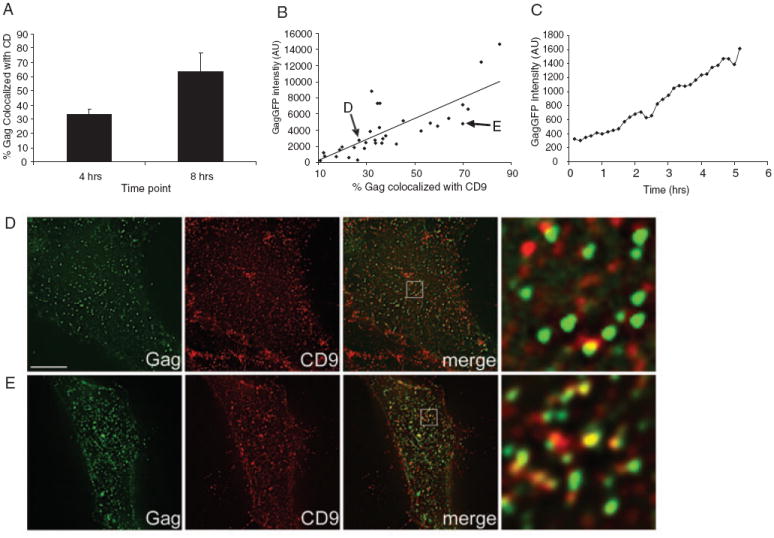
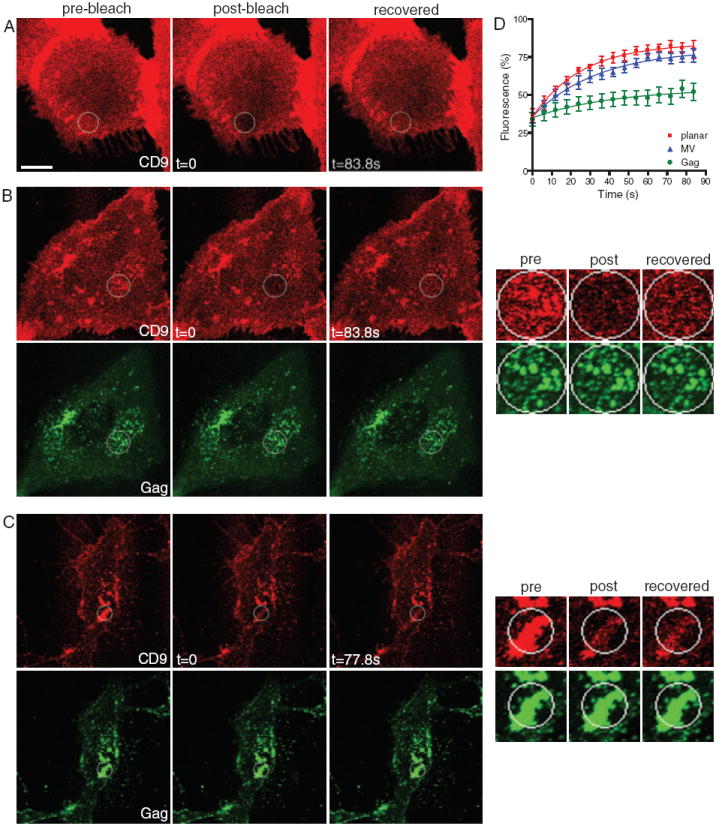
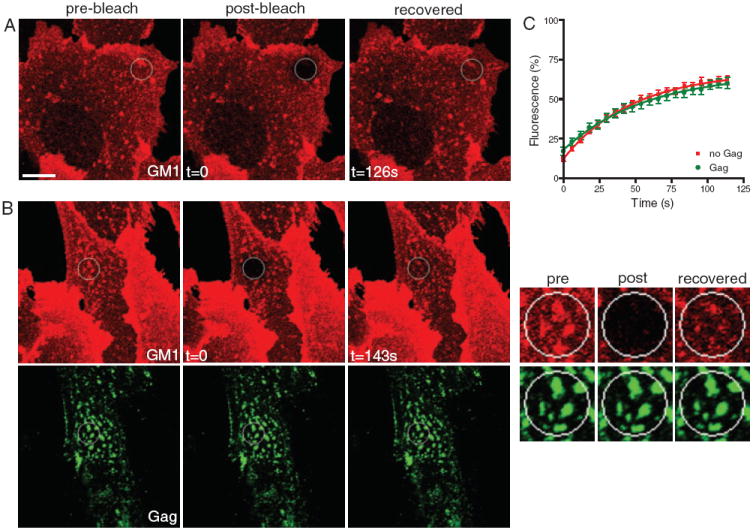
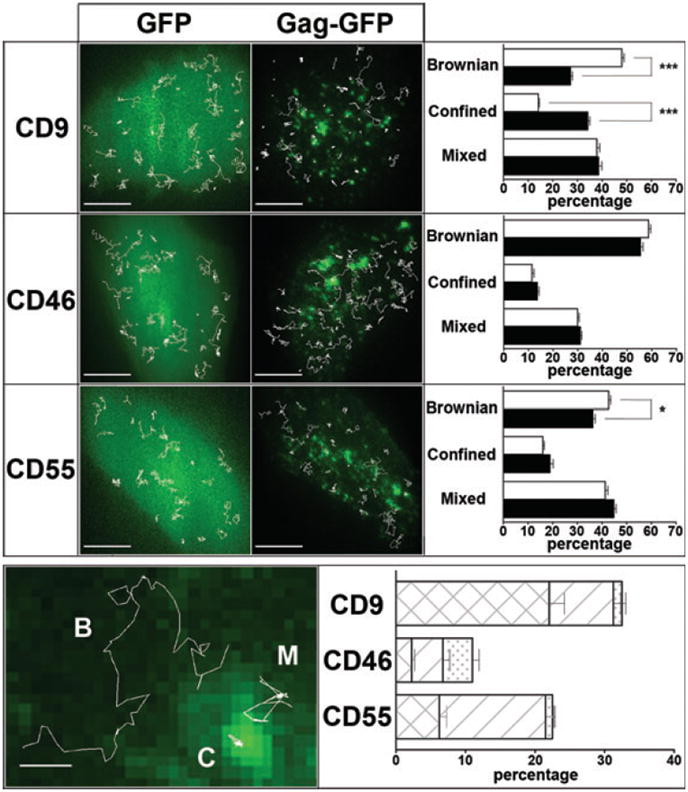
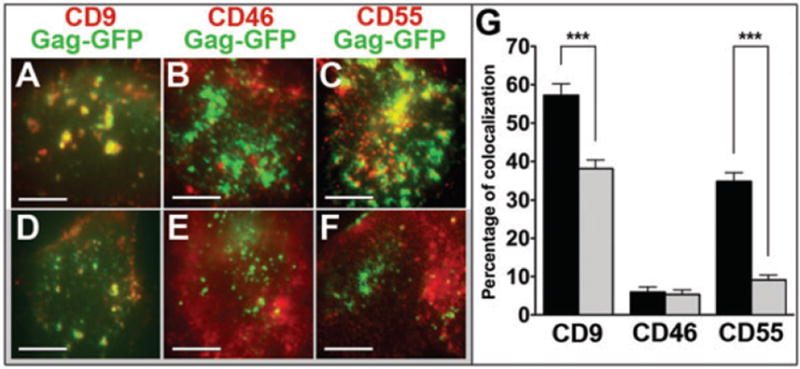
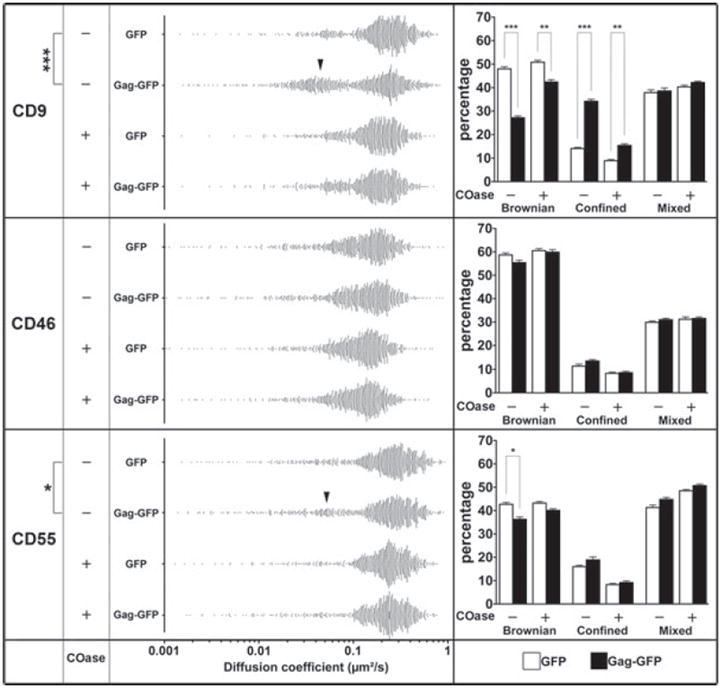
Partitioning of membrane proteins into various types of microdomains is crucial for many cellular functions. Tetraspanin-enriched microdomains (TEMs) are a unique type of protein-based microdomain, clearly distinct from membrane rafts, and important for several cellular processes such as fusion, migration and signaling. Paradoxically, HIV-1 assembly/egress occurs at TEMs, yet the viral particles also incorporate raft lipids. Using different quantitative microscopy approaches, we investigated the dynamic relationship between TEMs, membrane rafts and HIV-1 exit sites, focusing mainly on the tetraspanin CD9. Our results show that clustering of CD9 correlates with multimerization of the major viral structural component, Gag, at the plasma membrane. CD9 exhibited confined behavior and reduced lateral mobility at viral assembly sites, suggesting that Gag locally traps tetraspanins. In contrast, the raft lipid GM1 and the raft-associated protein CD55, while also recruited to assembly/budding sites, were only transiently trapped in these membrane areas. CD9 recruitment and confinement were found to be partially dependent on cholesterol, while those of CD55 were completely dependent on cholesterol. Importantly, our findings support the emerging concept that cellular and viral components, instead of clustering at preexisting microdomain platforms, direct the formation of distinct domains for the execution of specific functions.
Figures
Similar articles
-
Gag induces the coalescence of clustered lipid rafts and tetraspanin-enriched microdomains at HIV-1 assembly sites on the plasma membrane.J Virol. 2011 Oct;85(19):9749-66. doi: 10.1128/JVI.00743-11. Epub 2011 Aug 3. J Virol. 2011. PMID: 21813604 Free PMC article.
-
Relationships between plasma membrane microdomains and HIV-1 assembly.Biol Cell. 2010 Mar 25;102(6):335-50. doi: 10.1042/BC20090165. Biol Cell. 2010. PMID: 20356318 Free PMC article. Review.
-
Single-molecule analysis of CD9 dynamics and partitioning reveals multiple modes of interaction in the tetraspanin web.J Cell Biol. 2008 Aug 25;182(4):765-76. doi: 10.1083/jcb.200803010. Epub 2008 Aug 18. J Cell Biol. 2008. PMID: 18710926 Free PMC article.
-
Mapping of tetraspanin-enriched microdomains that can function as gateways for HIV-1.J Cell Biol. 2006 Jun 5;173(5):795-807. doi: 10.1083/jcb.200508165. Epub 2006 May 30. J Cell Biol. 2006. PMID: 16735575 Free PMC article.
-
Viruses and tetraspanins: lessons from single molecule approaches.Viruses. 2014 May 5;6(5):1992-2011. doi: 10.3390/v6051992. Viruses. 2014. PMID: 24800676 Free PMC article. Review.
Cited by
-
Lipid-specific oligomerization of the Marburg virus matrix protein VP40 is regulated by two distinct interfaces for virion assembly.J Biol Chem. 2021 Jan-Jun;296:100796. doi: 10.1016/j.jbc.2021.100796. Epub 2021 May 18. J Biol Chem. 2021. PMID: 34019871 Free PMC article.
-
CD82 and Gangliosides Tune CD81 Membrane Behavior.Int J Mol Sci. 2021 Aug 6;22(16):8459. doi: 10.3390/ijms22168459. Int J Mol Sci. 2021. PMID: 34445169 Free PMC article.
-
Tetraspanin Tspan9 regulates platelet collagen receptor GPVI lateral diffusion and activation.Platelets. 2017 Nov;28(7):629-642. doi: 10.1080/09537104.2016.1254175. Epub 2016 Dec 29. Platelets. 2017. PMID: 28032533 Free PMC article.
-
The tetraspanin CD9 facilitates MERS-coronavirus entry by scaffolding host cell receptors and proteases.PLoS Pathog. 2017 Jul 31;13(7):e1006546. doi: 10.1371/journal.ppat.1006546. eCollection 2017 Jul. PLoS Pathog. 2017. PMID: 28759649 Free PMC article.
-
Roles of RNA scaffolding in nanoscale Gag multimerization and selective protein sorting at HIV membranes.Sci Adv. 2024 Feb 23;10(8):eadk8297. doi: 10.1126/sciadv.adk8297. Epub 2024 Feb 23. Sci Adv. 2024. PMID: 38394201 Free PMC article.
References
-
- Pike LJ. Lipid rafts: bringing order to chaos. J Lipid Res. 2003;44:655–667. - PubMed
-
- Pike LJ. Rafts defined: a report on the Keystone Symposium on lipid rafts and cell function. J Lipid Res. 2006;47:1597–1598. - PubMed
-
- Goswami D, Gowrishankar K, Bilgrami S, Ghosh S, Raghupathy R, Chadda R, Vishwakarma R, Rao M, Mayor S. Nanoclusters of GPI-anchored proteins are formed by cortical actin-driven activity. Cell. 2008;135:1085–1097. - PubMed
-
- Eggeling C, Ringemann C, Medda R, Schwarzmann G, Sandhoff K, Polyakova S, Belov VN, Hein B, von Middendorff C, Schonle A, Hell SW. Direct observation of the nanoscale dynamics of membrane lipids in a living cell. Nature. 2009;457:1159–1162. - PubMed
-
- Jacobson K, Mouritsen OG, Anderson RG. Lipid rafts: at a crossroad between cell biology and physics. Nat Cell Biol. 2007;9:7–14. - PubMed
Publication types
MeSH terms
Substances
Grants and funding
LinkOut - more resources
Full Text Sources
Miscellaneous
