. 2010 Oct;20(10):1361-8.
doi: 10.1101/gr.103945.109. Epub 2010 Aug 17.

p53 binds preferentially to genomic regions with high DNA-encoded nucleosome occupancy

Affiliations

p53 binds preferentially to genomic regions with high DNA-encoded nucleosome occupancy

Efrat Lidor Nili et al. Genome Res. 2010 Oct.

Abstract

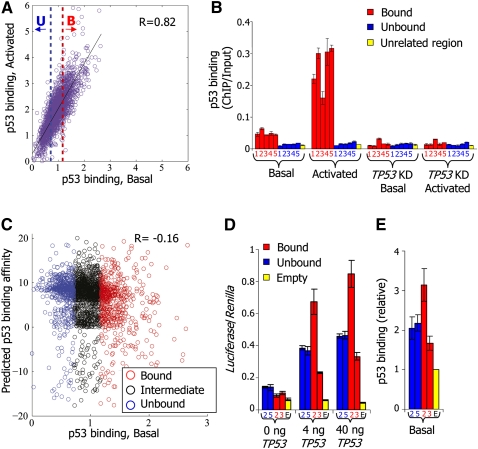
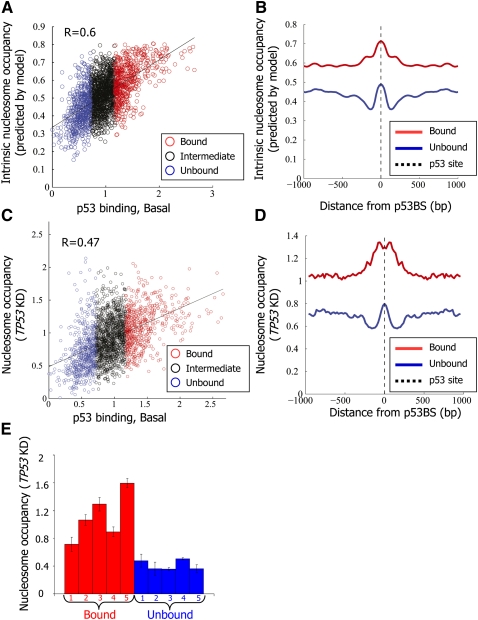
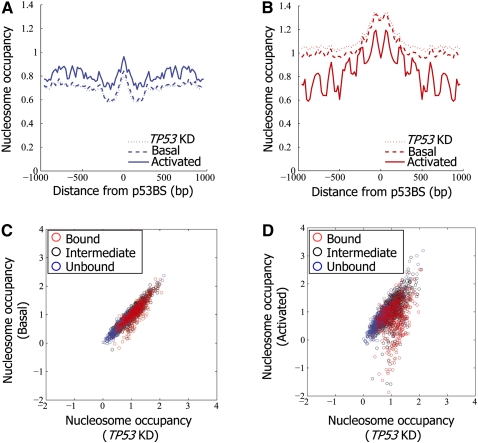
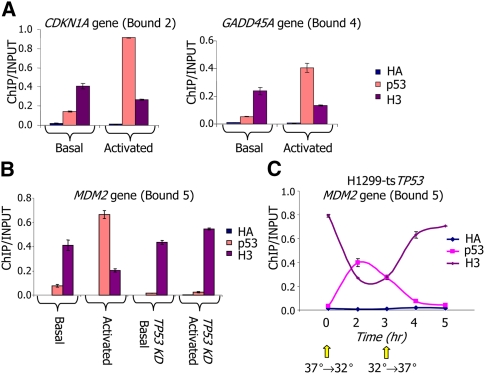
The human transcription factor TP53 is a pivotal roadblock against cancer. A key unresolved question is how the p53 protein selects its genomic binding sites in vivo out of a large pool of potential consensus sites. We hypothesized that chromatin may play a significant role in this site-selection process. To test this, we used a custom DNA microarray to measure p53 binding at approximately 2000 sites predicted to possess high-sequence specificity, and identified both strongly bound and weakly bound sites. When placed within a plasmid, weakly bound sites become p53 responsive and regain p53 binding when stably integrated into random genomic locations. Notably, strongly bound sites reside preferentially within genomic regions whose DNA sequence is predicted to encode relatively high intrinsic nucleosome occupancy. Using in vivo nucleosome occupancy measurements under conditions where p53 is inactive, we experimentally confirmed this prediction. Furthermore, upon p53 activation, nucleosomes are partially displaced from a relatively broad region surrounding the bound p53 sites, and this displacement is rapidly reversed upon inactivation of p53. Thus, in contrast to the general assumption that transcription-factor binding is preferred in sites that have low nucleosome occupancy prior to factor activation, we find that p53 binding occurs preferentially within a chromatin context of high intrinsic nucleosome occupancy.


Figures

Figure 1.
Figure 1.
p53 sequence specificity is not a sufficient predictor of p53 binding in vivo. (A) For each of the putative p53-binding sites around which we measured p53 binding with a high-resolution tiling array, shown is the log-ratio between p53 ChIP and input-sonicated genomic DNA, averaged across the probes that tile the 500-bp region centered around the site. For each site, binding is shown for nonstressed MCF7 cells expressing endogenous wild-type p53 (p53 binding, Basal, x-axis), as well as for MCF7 cells in which p53 had been activated by exposure to the DNA damaging agent Neocarzinostatin (p53 binding, Activated, y-axis). The blue-dotted line marks the arbitrary binding cutoff in the basal condition below which we define sites as unbound (U, lowest 25% of the sites). The red-dotted line marks the cutoff above which we define sites as bound (B, highest 25% of the sites). The correlation between binding in basal and activated conditions across all sites is indicated. (B) Small-scale validation of p53 binding. ChIP was performed with antibodies against p53, followed by quantification by qPCR of ChIP vs. input-sonicated genomic DNA for five bound and five unbound sites, among which are the well-described sites at the CDKN1A (bound2), GADD45A (bound4), and MDM2 (bound5) genes, as defined in A (identifier numbers and full details of the sites are provided in Supplemental Table 1), as well as for one unrelated control region. Shown are the average and standard deviation (calculated from duplicate qPCR reactions) of p53-binding values at each site, for nonstressed MCF7 cells (Basal), MCF7 cells in which p53 was activated by Neocarzinostatin (Activated), MCF7 cells with shRNA-mediated stable TP53 knockdown (TP53KD, Basal), and MCF7 cells with stable TP53 knockdown treated with Neocarzinostatin (TP53KD, Activated). (C) p53-binding affinity is a poor predictor of p53 binding. For each of the putative p53-binding sites at which we measured p53 binding, shown is its predicted affinity for p53 using a log-ratio of a model of p53-binding specificities (Wei et al. 2006) to genome background (y-axis) and its measured binding in nonstressed MCF7 cells (p53 binding, Basal, x-axis). The correlation between predicted binding affinity and measured binding in the basal condition across all sites is indicated. Unbound and Bound are as in A; Intermediate corresponds to the remaining 50% of sites, defined as possessing intermediate p53 binding. (D) When cloned in a plasmid in front of a luciferase reporter gene, bound and unbound sites are equally effective in conferring p53 responsiveness. H1299 cells were transfected separately with luciferase plasmids carrying either bound or unbound sites as indicated, or no site (empty), together with increasing amounts of a TP53 expression plasmid (x-axis). Shown are averages and standard deviations (three biological replicates) of Firefly luciferase values, normalized by cotransfected Renilla luciferase reporter values. Full site details are shown in Supplemental Table 1. (E) When randomly integrated into the human genome, bound and unbound sites are equally bound by p53. HCT116 cells were stably transfected separately with luciferase plasmids carrying either bound or unbound sites or no site (empty), as indicated. ChIP was performed with antibodies against p53, followed by quantification by qPCR of ChIP vs. input-sonicated genomic DNA. Values for each site were divided by the values of p53 binding obtained from the empty plasmid. Shown are the average and standard deviation (calculated from duplicate qPCR reactions) of relative p53-binding values at each site.
Figure 2.
Figure 2.
p53 binds preferentially regions with high intrinsic nucleosome occupancy. (A) For each of the putative p53-binding sites around which p53 binding was measured, shown is the log-ratio between p53 ChIP in nonstressed MCF7 cells and input-sonicated genomic DNA in the 500 bp surrounding the p53BS (p53 binding, Basal, x-axis; the same as in Fig. 1A), and the intrinsic nucleosome occupancy predicted by a model of nucleosome sequence preferences (Kaplan et al. 2009) (y-axis). Model predictions are shown as the average nucleosome occupancy per base pair across the 2000-bp region centered on each site. Sites are colored blue, black, or red, according to their classification from Figure 1A into unbound, intermediate-binding, or bound sites, respectively. The correlation between the nucleosome model predictions and measured p53 binding in the basal condition is indicated. (B) Model-predicted nucleosome occupancy per base pair, averaged across all p53-bound sites (red) and p53-unbound sites (blue), and shown along the 2000-bp region centered on each site. (C,D) Same as A and B, respectively, except that the y-axis corresponds to experimental measurements of nucleosome occupancy using the same tiling array as that used for measuring p53 binding in MCF7 cells with shRNA-mediated stable TP53 knockdown (TP53KD). Nucleosome measurements are shown as log-ratio between the nucleosome sample and sonicated genomic DNA. (E) Small-scale validation of the nucleosome occupancy measurements from C. Mononucleosomes were prepared from MCF7 cells with shRNA-mediated stable TP53 knockdown (TP53KD) by limited micrococcal nuclease digestion. Mononucleosomal DNA was subjected to quantification by qPCR for the five bound and five unbound sites listed in Supplemental Table 1, and values were normalized for qPCR readings of input-sonicated genomic DNA. Shown are the average and standard deviation (calculated from duplicate qPCR reactions).
Figure 3.
Figure 3.
Nucleosomes are depleted from p53-bound sites upon activation of p53. (A) Nucleosome occupancy measurements per base pair, averaged across the p53-unbound sites (as defined in Fig. 1A), and shown along the 2000-bp region centered on each site. Results are shown for nonstressed MCF7 cells (Basal), MCF7 cells in which p53 was activated by Neocarzinostatin (Activated), and MCF7 cells with shRNA-mediated stable TP53 knockdown (TP53KD). Nucleosome measurements are shown as log-ratio between nucleosome sample and sonicated genomic DNA. (B) Same as in A, for the p53-bound sites. (C) Shown are nucleosome occupancy measurements (log-ratio between nucleosomal sample and sonicated genomic DNA) across the unbound (blue), intermediate-binding (black), and bound (red) p53 sites as defined in Figure 1A, averaged across all of the array probes that tile the 2000-bp region centered around the site. Results are shown for nonstressed MCF7 cells expressing endogenous wild-type p53 (Basal, y-axis) as well as cells with shRNA-mediated stable TP53 knockdown (TP53KD, x-axis). (D) Same as C, except that the y-axis corresponds to nucleosome measurements in MCF7 cells in which p53 was activated by Neocarzinostatin (Activated). Note the marked reduction of average nucleosome occupancy at many p53-bound sites (red group).
Figure 4.
Figure 4.
Nucleosome depletion from p53-bound sites is transient and rapidly reversible. (A) ChIP was performed with antibodies against p53, histone H3, or HA epitope tag (HA) as control, followed by quantification by qPCR of ChIP and input-sonicated genomic DNA for two bound sites, as defined in Figure 1A. Shown are the average and standard deviation (calculated from duplicate qPCR reactions) in nonstressed MCF7 cells (basal), and in MCF7 cells in which p53 was activated by Neocarzinostatin. Full details of selected sites are shown in Supplemental Table 1. (B) Similar to A but for a different p53-bound site, and where in addition to the cellular conditions measured in A, also shown are measurements in MCF7 cells with shRNA-mediated stable TP53 knockdown (TP53KD, Basal), and MCF7 cells with stable TP53 knockdown and treatment with Neocarzinostatin (TP53KD, Activated). (C) Similar to B, but measured throughout a time-course in H1299-tsTP53 cells harboring a temperature-sensitive TP53 mutant. At time zero, cultures were shifted from 37°C to the permissive temperature (32°C), resulting in p53 activation. After 3 h from the initial shift, cultures were shifted back to 37°C to turn off p53 transcriptional activity.

Similar articles

Cited by

References

    1. Albert I, Mavrich TN, Tomsho LP, Qi J, Zanton SJ, Schuster SC, Pugh BF 2007. Translational and rotational settings of H2A.Z nucleosomes across the Saccharomyces cerevisiae genome. Nature 446: 572–576 - PubMed
    1. Aylon Y, Oren M 2007. Living with p53, dying of p53. Cell 130: 597–600 - PubMed
    1. Barski A, Cuddapah S, Cui K, Roh TY, Schones DE, Wang Z, Wei G, Chepelev I, Zhao K 2007. High-resolution profiling of histone methylations in the human genome. Cell 129: 823–837 - PubMed
    1. Brummelkamp TR, Bernards R, Agami R 2002. A system for stable expression of short interfering RNAs in mammalian cells. Science 296: 550–553 - PubMed
    1. Cawley S, Bekiranov S, Ng HH, Kapranov P, Sekinger EA, Kampa D, Piccolboni A, Sementchenko V, Cheng J, Williams AJ, et al. 2004. Unbiased mapping of transcription factor binding sites along human chromosomes 21 and 22 points to widespread regulation of noncoding RNAs. Cell 116: 499–509 - PubMed

Publication types

Associated data