

Possible changes to arable crop yields by 2050
- PMID: 20713388
- PMCID: PMC2935124
- DOI: 10.1098/rstb.2010.0153
Possible changes to arable crop yields by 2050
Abstract
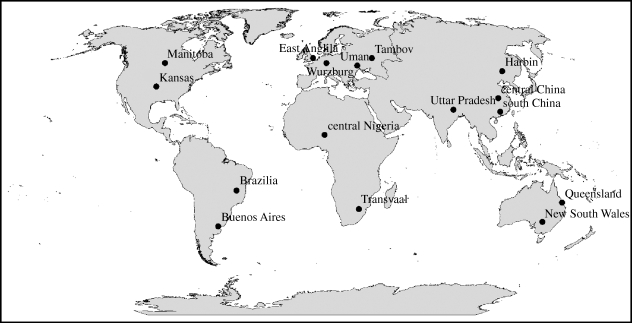
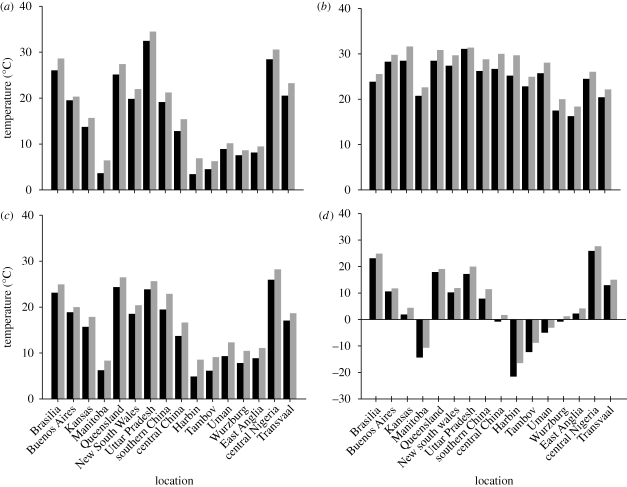
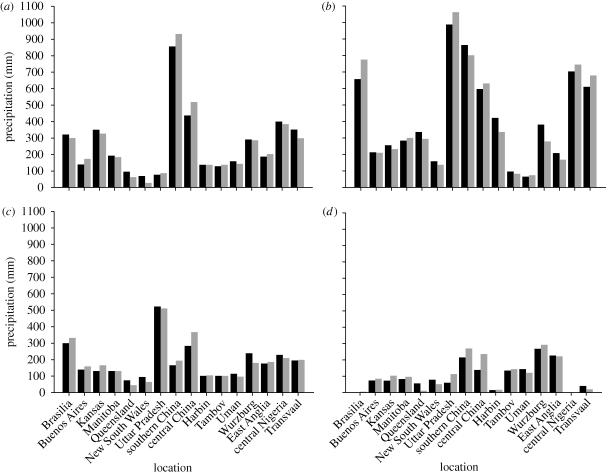
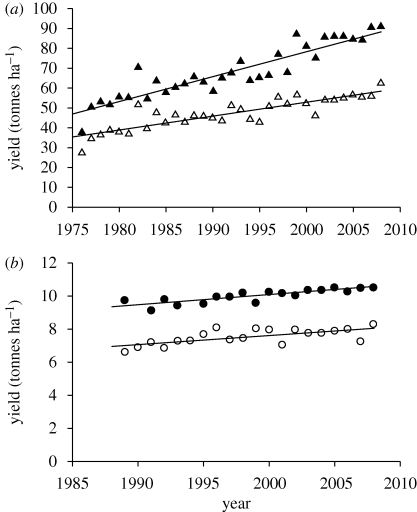
By 2050, the world population is likely to be 9.1 billion, the CO(2) concentration 550 ppm, the ozone concentration 60 ppb and the climate warmer by ca 2 degrees C. In these conditions, what contribution can increased crop yield make to feeding the world? CO(2) enrichment is likely to increase yields of most crops by approximately 13 per cent but leave yields of C4 crops unchanged. It will tend to reduce water consumption by all crops, but this effect will be approximately cancelled out by the effect of the increased temperature on evaporation rates. In many places increased temperature will provide opportunities to manipulate agronomy to improve crop performance. Ozone concentration increases will decrease yields by 5 per cent or more. Plant breeders will probably be able to increase yields considerably in the CO(2)-enriched environment of the future, and most weeds and airborne pests and diseases should remain controllable, so long as policy changes do not remove too many types of crop-protection chemicals. However, soil-borne pathogens are likely to be an increasing problem when warmer weather will increase their multiplication rates; control is likely to need a transgenic approach to breeding for resistance. There is a large gap between achievable yields and those delivered by farmers, even in the most efficient agricultural systems. A gap is inevitable, but there are large differences between farmers, even between those who have used the same resources. If this gap is closed and accompanied by improvements in potential yields then there is a good prospect that crop production will increase by approximately 50 per cent or more by 2050 without extra land. However, the demands for land to produce bio-energy have not been factored into these calculations.
Figures
Similar articles
-
Global warming, population growth, and natural resources for food production.Soc Nat Resour. 1991 Oct-Dec;4(4):347-63. doi: 10.1080/08941929109380766. Soc Nat Resour. 1991. PMID: 12344889
-
Global climate change increases risk of crop yield losses and food insecurity in the tropical Andes.Glob Chang Biol. 2018 Feb;24(2):e592-e602. doi: 10.1111/gcb.13959. Epub 2017 Nov 15. Glob Chang Biol. 2018. PMID: 29055170
-
Analysis of climate signals in the crop yield record of sub-Saharan Africa.Glob Chang Biol. 2018 Jan;24(1):143-157. doi: 10.1111/gcb.13901. Epub 2017 Oct 11. Glob Chang Biol. 2018. PMID: 28892592
-
Food security: increasing yield and improving resource use efficiency.Proc Nutr Soc. 2010 Nov;69(4):592-600. doi: 10.1017/S0029665110003836. Epub 2010 Sep 22. Proc Nutr Soc. 2010. PMID: 20860858 Review.
-
Global food insecurity. treatment of major food crops with elevated carbon dioxide or ozone under large-scale fully open-air conditions suggests recent models may have overestimated future yields.Philos Trans R Soc Lond B Biol Sci. 2005 Nov 29;360(1463):2011-20. doi: 10.1098/rstb.2005.1749. Philos Trans R Soc Lond B Biol Sci. 2005. PMID: 16433090 Free PMC article. Review.
Cited by
-
Distinguishing between yield advances and yield plateaus in historical crop production trends.Nat Commun. 2013;4:2918. doi: 10.1038/ncomms3918. Nat Commun. 2013. PMID: 24346131 Free PMC article.
-
Synergistic action of tropospheric ozone and carbon dioxide on yield and nutritional quality of Indian mustard (Brassica juncea (L.) Czern.).Environ Monit Assess. 2013 Aug;185(8):6517-29. doi: 10.1007/s10661-012-3043-9. Epub 2013 Jan 3. Environ Monit Assess. 2013. PMID: 23283603
-
Genome-wide association study of drought tolerance in wheat (Triticum aestivum L.) identifies SNP markers and candidate genes.Mol Genet Genomics. 2024 Mar 2;299(1):22. doi: 10.1007/s00438-024-02104-x. Mol Genet Genomics. 2024. PMID: 38430317 Free PMC article.
-
Effect of Warming and Elevated O3 Concentration on CO2 Emissions in a Wheat-Soybean Rotation Cropland.Int J Environ Res Public Health. 2019 May 17;16(10):1755. doi: 10.3390/ijerph16101755. Int J Environ Res Public Health. 2019. PMID: 31108948 Free PMC article.
-
Solutions for a cultivated planet.Nature. 2011 Oct 12;478(7369):337-42. doi: 10.1038/nature10452. Nature. 2011. PMID: 21993620
References
-
- Allen E. J., Allison M. F., Sparkes D. I.2005Physiological and technological limits to yield improvement in potatoes. In Yields of farmed species (eds Sylvester-Bradley R., Wiseman J.), pp. 289–309 Nottingham, UK: Nottingham University Press
-
- Amthor J. S.2001Effects of atmospheric CO2 concentration on wheat yield: review of results from experiments using various approaches to control CO2 concentration. Field Crops Res. 73, 1–34 (doi:10.1016/S0378-4290(01) - DOI
-
- Ashmore M. R.2002Effects of oxidants at the whole plant and community level. In Air pollution and plant life (eds Bell J. N. B., Treshow M.), pp. 89–118 Chichester, UK: Wiley
-
- Austin R. B.1999Yield of wheat in the United Kingdom: recent advances and prospects. Crop Sci. 39, 1604–1610
-
- Beadle C. L., Long S. P.1985Photosynthesis—is it limiting to biomass production? Biomass 8, 159–168
Publication types
MeSH terms
Substances
Grants and funding
LinkOut - more resources
Full Text Sources
Miscellaneous
