Regulatory T cell frequency in patients with melanoma with different disease stage and course, and modulating effects of high-dose interferon-alpha 2b treatment
- PMID: 20712892
- PMCID: PMC2936304
- DOI: 10.1186/1479-5876-8-76
Regulatory T cell frequency in patients with melanoma with different disease stage and course, and modulating effects of high-dose interferon-alpha 2b treatment
Abstract
Background: High-dose interferon-alpha 2b (IFN-alpha 2b) is the only approved systemic therapy in the United States for the adjuvant treatment of melanoma. The study objective was to explore the immunomodulatory mechanism of action for IFN-alpha 2b by measuring serum regulatory T cell (Treg), serum transforming growth factor-beta (TGF-beta), interleukin (IL)-10, and autoantibody levels in patients with melanoma treated with the induction phase of the high-dose IFN-alpha 2b regimen.
Methods: Patients with melanoma received IFN-alpha 2b administered intravenously (20 MU/m2 each day from day 1 to day 5 for 4 consecutive weeks). Serum Treg levels were measured as whole lymphocytes in CD4+ cells using flow cytometry while TGF-beta, IL-10, and autoantibody levels were measured using enzyme-linked immunosorbent assays.
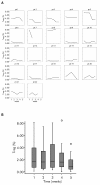
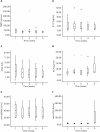
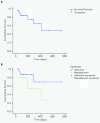
Results: Twenty-two patients with melanoma received IFN-alpha 2b treatment and were evaluated for Treg levels. Before treatment, Treg levels were significantly higher in patients with melanoma when compared with data from 20 healthy subjects (P = 0.001; Mann-Whitney test). Although a trend for reduction of Treg levels following IFN-α 2b treatment was observed (average decrease 0.29% per week), statistical significance was not achieved. Subgroup analyses indicated higher baseline Treg levels for stage III versus IV disease (P = 0.082), early recurrence versus no recurrence (P = 0.017), deceased versus surviving patients (P = 0.021), and preoperative neoadjuvant versus postoperative adjuvant treatment groups (not significant). No significant effects were observed on the levels of TGF-beta, IL-10, and autoantibodies in patients with melanoma treated with IFN-alpha 2b.
Conclusions: Patients with melanoma in this study showed increased basal levels of Treg that may be relevant to their disease and its progression. Treg levels shifted in patients with melanoma treated with IFN-alpha 2b, although no firm conclusions regarding the role of Tregs as a marker of treatment response or outcome can be made at present.
Figures


Similar articles
-
Reduction of circulating regulatory T cells by intravenous high-dose interferon alfa-2b treatment in melanoma patients.Clin Exp Metastasis. 2012 Oct;29(7):801-5. doi: 10.1007/s10585-012-9504-2. Epub 2012 Jul 1. Clin Exp Metastasis. 2012. PMID: 22752507
-
Multiparametric flow cytometric analysis of inter-patient variation in STAT1 phosphorylation following interferon Alfa immunotherapy.J Natl Cancer Inst. 2004 Sep 1;96(17):1331-42. doi: 10.1093/jnci/djh252. J Natl Cancer Inst. 2004. PMID: 15339971
-
Phase III trial comparing adjuvant treatment with pegylated interferon Alfa-2b versus observation: prognostic significance of autoantibodies--EORTC 18991.J Clin Oncol. 2010 May 10;28(14):2460-6. doi: 10.1200/JCO.2009.24.6264. Epub 2010 Apr 12. J Clin Oncol. 2010. PMID: 20385998 Clinical Trial.
-
Adjuvant therapy for resected stage III melanoma patients: high-dose interferon-alpha versus ipilimumab combined with kinases inhibitors.Tumori. 2012 Mar-Apr;98(2):185-90. doi: 10.1177/030089161209800202. Tumori. 2012. PMID: 22677983 Review.
-
Is there a role for adjuvant high-dose interferon-alpha-2b in the management of melanoma?Drugs. 2003;63(11):1053-8. doi: 10.2165/00003495-200363110-00001. Drugs. 2003. PMID: 12749732 Review.
Cited by
-
Meta-Analysis of the Safety and Efficacy of Interferon Combined With Dacarbazine Versus Dacarbazine Alone in Cutaneous Malignant Melanoma.Medicine (Baltimore). 2016 Apr;95(16):e3406. doi: 10.1097/MD.0000000000003406. Medicine (Baltimore). 2016. PMID: 27100429 Free PMC article. Review.
-
IL28B polymorphism cannot predict response to interferon alpha treatment in patients with melanoma.PLoS One. 2014 Nov 12;9(11):e112613. doi: 10.1371/journal.pone.0112613. eCollection 2014. PLoS One. 2014. PMID: 25389973 Free PMC article.
-
Low-dose temozolomide before dendritic-cell vaccination reduces (specifically) CD4+CD25++Foxp3+ regulatory T-cells in advanced melanoma patients.J Transl Med. 2013 May 31;11:135. doi: 10.1186/1479-5876-11-135. J Transl Med. 2013. PMID: 23725550 Free PMC article.
-
A key role of GARP in the immune suppressive tumor microenvironment.Oncotarget. 2016 Jul 12;7(28):42996-43009. doi: 10.18632/oncotarget.9598. Oncotarget. 2016. PMID: 27248166 Free PMC article.
-
Tumor Microenvironment: Implications in Melanoma Resistance to Targeted Therapy and Immunotherapy.Cancers (Basel). 2020 Oct 6;12(10):2870. doi: 10.3390/cancers12102870. Cancers (Basel). 2020. PMID: 33036192 Free PMC article. Review.
References
-
- Fecher LA, Flaherty KT. Where are we with adjuvant therapy of stage III and IV melanoma in 2009? J Natl Compr Canc Netw. 2009;7:295–304. - PubMed
-
- Kirkwood JM, Ibrahim JG, Sondak VK, Richards J, Flaherty LE, Ernstoff MS, Smith TJ, Rao U, Steele M, Blum RH. High- and low-dose interferon alfa-2b in high-risk melanoma: first analysis of intergroup trial E1690/S9111/C9190. J Clin Oncol. 2000;18:2444–2458. - PubMed
-
- Eggermont AM, Suciu S, Santinami M, Testori A, Kruit WH, Marsden J, Punt CJ, Salès F, Gore M, Mackie R, Kusic Z, Dummer R, Hauschild A, Musat E, Spatz A, Keilholz U. Adjuvant therapy with pegylated interferon alfa-2b versus observation alone in resected stage III melanoma: final results of EORTC 18991 a randomised phase III trial. Lancet. 2008;372:117–126. doi: 10.1016/S0140-6736(08)61033-8. - DOI - PubMed
Publication types
MeSH terms
Substances
LinkOut - more resources
Full Text Sources
Other Literature Sources
Medical
Research Materials

