Olfactory deficit detected by fMRI in early Alzheimer's disease
- PMID: 20709038
- PMCID: PMC3515873
- DOI: 10.1016/j.brainres.2010.08.018
Olfactory deficit detected by fMRI in early Alzheimer's disease
Abstract
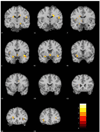
Alzheimer's disease (AD) is accompanied by smell dysfunction, as measured by psychophysical tests. Currently, it is unknown whether AD-related alterations in central olfactory system neural activity, as measured by functional magnetic resonance imaging (fMRI), are detectable beyond those observed in healthy elderly. Moreover, it is not known whether such changes are correlated with indices of odor perception and dementia. To investigate these issues, 12 early stage AD patients and 13 nondemented controls underwent fMRI while being exposed to each of three concentrations of lavender oil odorant. All participants were administered the University of Pennsylvania Smell Identification Test (UPSIT), the Mini-Mental State Examination (MMSE), the Mattis Dementia Rating Scale-2 (DRS-2), and the Clinical Dementia Rating Scale (CDR). The blood oxygen level-dependent (BOLD) signal at primary olfactory cortex (POC) was weaker in AD than in HC subjects. At the lowest odorant concentration, the BOLD signals within POC, hippocampus, and insula were significantly correlated with UPSIT, MMSE, DRS-2, and CDR scores. The BOLD signal intensity and activation volume within the POC increased significantly as a function of odorant concentration in the AD group, but not in the control group. These findings demonstrate that olfactory fMRI is sensitive to the AD-related olfactory and cognitive functional decline.
Copyright © 2010. Published by Elsevier B.V.
Figures


Similar articles
-
Olfactory cortex degeneration in Alzheimer's disease and mild cognitive impairment.J Alzheimers Dis. 2015;45(3):947-58. doi: 10.3233/JAD-141947. J Alzheimers Dis. 2015. PMID: 25633674
-
Smell identification function as a severity and progression marker in Alzheimer's disease.Int Psychogeriatr. 2013 Jul;25(7):1157-66. doi: 10.1017/S1041610213000446. Epub 2013 Apr 19. Int Psychogeriatr. 2013. PMID: 23597130
-
Olfactory function in mild cognitive impairment and Alzheimer's disease: an investigation using psychophysical and electrophysiological techniques.Am J Psychiatry. 2003 Nov;160(11):1995-2002. doi: 10.1176/appi.ajp.160.11.1995. Am J Psychiatry. 2003. PMID: 14594747
-
Olfaction in persons with Alzheimer's disease.Neuropsychol Rev. 1998 Mar;8(1):11-23. doi: 10.1023/a:1025627106073. Neuropsychol Rev. 1998. PMID: 9585920 Review.
-
Smell identification function and Alzheimer's disease: a selective review.Curr Opin Psychiatry. 2015 Mar;28(2):173-9. doi: 10.1097/YCO.0000000000000146. Curr Opin Psychiatry. 2015. PMID: 25594420 Review.
Cited by
-
Olfactory deficit: a potential functional marker across the Alzheimer's disease continuum.Front Neurosci. 2024 Feb 16;18:1309482. doi: 10.3389/fnins.2024.1309482. eCollection 2024. Front Neurosci. 2024. PMID: 38435057 Free PMC article. Review.
-
Cerebral hypometabolism mediates the effect of stroke volume on cognitive impairment in heart failure patients.ESC Heart Fail. 2024 Feb;11(1):444-455. doi: 10.1002/ehf2.14599. Epub 2023 Nov 30. ESC Heart Fail. 2024. PMID: 38037178 Free PMC article.
-
Associations of olfactory function with brain structural and functional outcomes. A systematic review.Ageing Res Rev. 2023 Dec;92:102095. doi: 10.1016/j.arr.2023.102095. Epub 2023 Oct 30. Ageing Res Rev. 2023. PMID: 37913831 Review.
-
Morphometric analysis of medial temporal lobe subregions in Alzheimer's disease using high-resolution MRI.Brain Struct Funct. 2023 Nov;228(8):1885-1899. doi: 10.1007/s00429-023-02683-2. Epub 2023 Jul 24. Brain Struct Funct. 2023. PMID: 37486408
-
Odor Discrimination as a Marker of Early Alzheimer's Disease.J Alzheimers Dis. 2023;94(3):1169-1178. doi: 10.3233/JAD-230077. J Alzheimers Dis. 2023. PMID: 37355894 Free PMC article.
References
-
- Albers MW, Tabert MH, Devanand DP. Olfactory dysfunction as a predictor of neurodegenerative disease. Curr Neurol Neursci Rep. 2006;6:379–386. - PubMed
-
- Allen WF. Studies on the level of anesthesia for the olfactory and trigeminal respiratory reflexes in dogs and rabbits. Am J Physiol. 1936;115:579–587.
-
- Attems J, Jellinger KA. Olfactory tau pathology in Alzheimer disease and mild cognitive impairment. Clin Neuropathol. 25:265–271. - PubMed
-
- Braak H, Braak E. Evolution of the neuropathology of Alzheimer's disease. Acta Neurol Scand. 1996;165:3–12. - PubMed
Publication types
MeSH terms
Grants and funding
LinkOut - more resources
Full Text Sources
Medical

