Transcriptomic analysis reveals a mechanism for a prefibrotic phenotype in STAT1 knockout mice during severe acute respiratory syndrome coronavirus infection
- PMID: 20702617
- PMCID: PMC2953159
- DOI: 10.1128/JVI.01130-10
Transcriptomic analysis reveals a mechanism for a prefibrotic phenotype in STAT1 knockout mice during severe acute respiratory syndrome coronavirus infection
Abstract
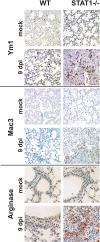
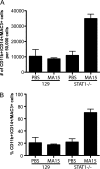
Severe acute respiratory syndrome coronavirus (SARS-CoV) infection can cause the development of severe end-stage lung disease characterized by acute respiratory distress syndrome (ARDS) and pulmonary fibrosis. The mechanisms by which pulmonary lesions and fibrosis are generated during SARS-CoV infection are not known. Using high-throughput mRNA profiling, we examined the transcriptional response of wild-type (WT), type I interferon receptor knockout (IFNAR1-/-), and STAT1 knockout (STAT1-/-) mice infected with a recombinant mouse-adapted SARS-CoV (rMA15) to better understand the contribution of specific gene expression changes to disease progression. Despite a deletion of the type I interferon receptor, strong expression of interferon-stimulated genes was observed in the lungs of IFNAR1-/- mice, contributing to clearance of the virus. In contrast, STAT1-/- mice exhibited a defect in the expression of interferon-stimulated genes and were unable to clear the infection, resulting in a lethal outcome. STAT1-/- mice exhibited dysregulation of T-cell and macrophage differentiation, leading to a TH2-biased immune response and the development of alternatively activated macrophages that mediate a profibrotic environment within the lung. We propose that a combination of impaired viral clearance and T-cell/macrophage dysregulation causes the formation of prefibrotic lesions in the lungs of rMA15-infected STAT1-/- mice.
Figures



Similar articles
-
Induction of alternatively activated macrophages enhances pathogenesis during severe acute respiratory syndrome coronavirus infection.J Virol. 2012 Dec;86(24):13334-49. doi: 10.1128/JVI.01689-12. Epub 2012 Sep 26. J Virol. 2012. PMID: 23015710 Free PMC article.
-
SARS-CoV pathogenesis is regulated by a STAT1 dependent but a type I, II and III interferon receptor independent mechanism.PLoS Pathog. 2010 Apr 8;6(4):e1000849. doi: 10.1371/journal.ppat.1000849. PLoS Pathog. 2010. PMID: 20386712 Free PMC article.
-
Combined action of type I and type III interferon restricts initial replication of severe acute respiratory syndrome coronavirus in the lung but fails to inhibit systemic virus spread.J Gen Virol. 2012 Dec;93(Pt 12):2601-2605. doi: 10.1099/vir.0.046284-0. Epub 2012 Sep 5. J Gen Virol. 2012. PMID: 22956738
-
MyD88 is required for protection from lethal infection with a mouse-adapted SARS-CoV.PLoS Pathog. 2008 Dec;4(12):e1000240. doi: 10.1371/journal.ppat.1000240. Epub 2008 Dec 12. PLoS Pathog. 2008. PMID: 19079579 Free PMC article.
-
The role of epidermal growth factor receptor (EGFR) signaling in SARS coronavirus-induced pulmonary fibrosis.Antiviral Res. 2017 Jul;143:142-150. doi: 10.1016/j.antiviral.2017.03.022. Epub 2017 Apr 5. Antiviral Res. 2017. PMID: 28390872 Free PMC article. Review.
Cited by
-
A network integration approach to predict conserved regulators related to pathogenicity of influenza and SARS-CoV respiratory viruses.PLoS One. 2013 Jul 25;8(7):e69374. doi: 10.1371/journal.pone.0069374. Print 2013. PLoS One. 2013. PMID: 23935999 Free PMC article.
-
Regulator of Cell Cycle Protein (RGCC/RGC-32) Protects against Pulmonary Fibrosis.Am J Respir Cell Mol Biol. 2022 Feb;66(2):146-157. doi: 10.1165/rcmb.2021-0022OC. Am J Respir Cell Mol Biol. 2022. PMID: 34668840 Free PMC article.
-
Molecular pathology of emerging coronavirus infections.J Pathol. 2015 Jan;235(2):185-95. doi: 10.1002/path.4454. J Pathol. 2015. PMID: 25270030 Free PMC article. Review.
-
Type I and Type III Interferons - Induction, Signaling, Evasion, and Application to Combat COVID-19.Cell Host Microbe. 2020 Jun 10;27(6):870-878. doi: 10.1016/j.chom.2020.05.008. Epub 2020 May 27. Cell Host Microbe. 2020. PMID: 32464097 Free PMC article. Review.
-
Attenuation and restoration of severe acute respiratory syndrome coronavirus mutant lacking 2'-o-methyltransferase activity.J Virol. 2014 Apr;88(8):4251-64. doi: 10.1128/JVI.03571-13. Epub 2014 Jan 29. J Virol. 2014. PMID: 24478444 Free PMC article.
References
-
- Belperio, J. A., M. Dy, L. Murray, M. D. Burdick, Y. Y. Xue, R. M. Strieter, and M. P. Keane. 2004. The role of the Th2 CC chemokine ligand CCL17 in pulmonary fibrosis. J. Immunol. 173:4692-4698. - PubMed
-
- Billharz, R., H. Zeng, S. C. Proll, M. J. Korth, S. Lederer, R. Albrecht, A. G. Goodman, E. Rosenzweig, T. M. Tumpey, A. García-Sastre, and M. G. Katze. 2009. The NS1 protein of the 1918 pandemic influenza virus blocks host interferon and lipid metabolism pathways. J. Virol. 83:10557-10570. - PMC - PubMed
-
- Björkman, L., J. Karlsson, A. Karlsson, M. Rabiet, F. Boulay, H. Fu, J. Bylund, and C. Dahlgren. 2008. Serum amyloid A mediates human neutrophil production of reactive oxygen species through a receptor independent of formyl peptide receptor like-1. J. Leukoc. Biol. 83:245-253. - PubMed
-
- Boivin, G., Y. Abed, G. Pelletier, L. Ruel, D. Moisan, S. Côté, T. C. T. Peret, D. D. Erdman, and L. J. Anderson. 2002. Virological features and clinical manifestations associated with human metapneumovirus: a new paramyxovirus responsible for acute respiratory-tract infections in all age groups. J. Infect. Dis. 186:1330-1334. - PubMed
Publication types
MeSH terms
Substances
Grants and funding
LinkOut - more resources
Full Text Sources
Molecular Biology Databases
Research Materials
Miscellaneous

