Influence of climate on malaria transmission depends on daily temperature variation
- PMID: 20696913
- PMCID: PMC2930540
- DOI: 10.1073/pnas.1006422107
Influence of climate on malaria transmission depends on daily temperature variation
Abstract
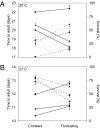
Malaria transmission is strongly influenced by environmental temperature, but the biological drivers remain poorly quantified. Most studies analyzing malaria-temperature relations, including those investigating malaria risk and the possible impacts of climate change, are based solely on mean temperatures and extrapolate from functions determined under unrealistic laboratory conditions. Here, we present empirical evidence to show that, in addition to mean temperatures, daily fluctuations in temperature affect parasite infection, the rate of parasite development, and the essential elements of mosquito biology that combine to determine malaria transmission intensity. In general, we find that, compared with rates at equivalent constant mean temperatures, temperature fluctuation around low mean temperatures acts to speed up rate processes, whereas fluctuation around high mean temperatures acts to slow processes down. At the extremes (conditions representative of the fringes of malaria transmission, where range expansions or contractions will occur), fluctuation makes transmission possible at lower mean temperatures than currently predicted and can potentially block transmission at higher mean temperatures. If we are to optimize control efforts and develop appropriate adaptation or mitigation strategies for future climates, we need to incorporate into predictive models the effects of daily temperature variation and how that variation is altered by climate change.
Conflict of interest statement
The authors declare no conflict of interest.
Figures


Similar articles
-
Mapping Physiological Suitability Limits for Malaria in Africa Under Climate Change.Vector Borne Zoonotic Dis. 2015 Dec;15(12):718-25. doi: 10.1089/vbz.2015.1822. Epub 2015 Nov 18. Vector Borne Zoonotic Dis. 2015. PMID: 26579951 Free PMC article.
-
Implications of temperature variation for malaria parasite development across Africa.Sci Rep. 2013;3:1300. doi: 10.1038/srep01300. Sci Rep. 2013. PMID: 23419595 Free PMC article.
-
Estimating air temperature and its influence on malaria transmission across Africa.PLoS One. 2013;8(2):e56487. doi: 10.1371/journal.pone.0056487. Epub 2013 Feb 20. PLoS One. 2013. PMID: 23437143 Free PMC article.
-
The ecology of Anopheles mosquitoes under climate change: case studies from the effects of deforestation in East African highlands.Ann N Y Acad Sci. 2012 Feb;1249:204-10. doi: 10.1111/j.1749-6632.2011.06432.x. Epub 2012 Feb 9. Ann N Y Acad Sci. 2012. PMID: 22320421 Free PMC article. Review.
-
Climate, environment and transmission of malaria.Infez Med. 2016 Jun 1;24(2):93-104. Infez Med. 2016. PMID: 27367318 Review.
Cited by
-
Cold snaps lead to a 5-fold increase or a 3-fold decrease in disease proliferation depending on the baseline temperature.BMC Biol. 2024 Oct 29;22(1):250. doi: 10.1186/s12915-024-02041-6. BMC Biol. 2024. PMID: 39472912 Free PMC article.
-
Mean daily temperatures can predict the thermal limits of malaria transmission better than rate summation.bioRxiv [Preprint]. 2024 Sep 23:2024.09.20.614098. doi: 10.1101/2024.09.20.614098. bioRxiv. 2024. PMID: 39386442 Free PMC article. Preprint.
-
Temperature dependence of mosquitoes: Comparing mechanistic and machine learning approaches.PLoS Negl Trop Dis. 2024 Sep 16;18(9):e0012488. doi: 10.1371/journal.pntd.0012488. eCollection 2024 Sep. PLoS Negl Trop Dis. 2024. PMID: 39283940 Free PMC article.
-
Range dynamics of Anopheles mosquitoes in Africa suggest a significant increase in the malaria transmission risk.Ecol Evol. 2024 Jul 31;14(8):e70059. doi: 10.1002/ece3.70059. eCollection 2024 Aug. Ecol Evol. 2024. PMID: 39091337 Free PMC article.
-
Influence of environmental, geographic, socio-demographic, and epidemiological factors on presence of malaria at the community level in two continents.Sci Rep. 2024 Jul 20;14(1):16734. doi: 10.1038/s41598-024-67452-5. Sci Rep. 2024. PMID: 39030306 Free PMC article.
References
-
- Dietz K. The estimation of the basic reproduction number for infectious diseases. Stat Methods Med Res. 1993;2:23–41. - PubMed
-
- Craig MH, Snow RW, Le Sueur D. A climate-based distribution model of malaria transmission in sub-Saharan Africa. Parasitol Today. 1999;15:105–111. - PubMed
-
- Rogers DJ, Randolph SE. In: Global Mapping of Infectious Diseases: Methods, Examples and Emerging Applications (Advances in Parasitology) Hay SI, Graham A, Rogers DJ, editors. San Diego: Elsevier; 2006. pp. 345–381. - PubMed
-
- Harvell CD, et al. Climate warming and disease risks for terrestrial and marine biota. Science. 2002;296:2158–2162. - PubMed
Publication types
MeSH terms
LinkOut - more resources
Full Text Sources
Other Literature Sources
Medical

