Mouse atonal homolog 1 directs intestinal progenitors to secretory cell rather than absorptive cell fate
- PMID: 20691176
- PMCID: PMC2945455
- DOI: 10.1016/j.ydbio.2010.07.026
Mouse atonal homolog 1 directs intestinal progenitors to secretory cell rather than absorptive cell fate
Abstract
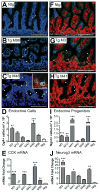
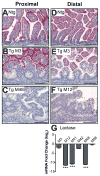
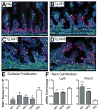
The Notch-regulated transcription factor mouse atonal homolog 1 (Math1) is required for the development of intestinal secretory cells, as demonstrated by the loss of goblet, endocrine and Paneth cell types in null mice. However, it was unknown whether Math1 is sufficient to induce the program of secretory cell differentiation. To examine the function of Math1 in the differentiation of intestinal epithelial cells, intestinal morphology and epithelial and mesenchymal cell fate were examined by histological staining and marker gene expression in transgenic mice expressing a villin-regulated Math1 transgene. Late prenatal transgenic founders exhibited a gross cellular transformation into a secretory epithelium. The expansion of secretory cells coupled with the almost complete loss of absorptive enterocytes suggested reprogramming of a bipotential progenitor cell. Moreover, Math1 expression inhibited epithelial cell proliferation, as demonstrated by a marked reduction in Ki67 positive cells and blunted villi. Unexpectedly, the transgenic mesenchyme was greatly expanded with increased proliferation. Several mesenchymal cell types were amplified, including smooth muscle and neurons, with maintenance of basic radial patterning. Since transgenic Math1 expression was restricted to the epithelium, these findings suggest that epithelial-mesenchymal signaling is altered by the cellular changes induced by Math1. Thus, Math1 is a key effector directing multipotential precursors to adopt secretory and not absorptive cell fate.
Copyright © 2010 Elsevier Inc. All rights reserved.
Conflict of interest statement
DISCLOSURES: The authors have no conflicts to disclose.
Figures


Similar articles
-
Basic helix-loop-helix transcription factors and enteroendocrine cell differentiation.Diabetes Obes Metab. 2011 Oct;13 Suppl 1(0 1):5-12. doi: 10.1111/j.1463-1326.2011.01438.x. Diabetes Obes Metab. 2011. PMID: 21824251 Free PMC article. Review.
-
Intestine-specific ablation of mouse atonal homolog 1 (Math1) reveals a role in cellular homeostasis.Gastroenterology. 2007 Jun;132(7):2478-88. doi: 10.1053/j.gastro.2007.03.047. Epub 2007 Mar 24. Gastroenterology. 2007. PMID: 17570220
-
Requirement of Math1 for secretory cell lineage commitment in the mouse intestine.Science. 2001 Dec 7;294(5549):2155-8. doi: 10.1126/science.1065718. Science. 2001. PMID: 11739954
-
Genetic evidence that intestinal Notch functions vary regionally and operate through a common mechanism of Math1 repression.J Biol Chem. 2011 Apr 1;286(13):11427-33. doi: 10.1074/jbc.M110.188797. Epub 2011 Jan 31. J Biol Chem. 2011. PMID: 21282114 Free PMC article.
-
Minireview: Development and differentiation of gut endocrine cells.Endocrinology. 2004 Jun;145(6):2639-44. doi: 10.1210/en.2004-0051. Epub 2004 Mar 24. Endocrinology. 2004. PMID: 15044355 Review.
Cited by
-
Tuft cells in the intestine, immunity and beyond.Nat Rev Gastroenterol Hepatol. 2024 Dec;21(12):852-868. doi: 10.1038/s41575-024-00978-1. Epub 2024 Sep 26. Nat Rev Gastroenterol Hepatol. 2024. PMID: 39327439 Review.
-
The role of the Notch signalling pathway in the pathogenesis of ulcerative colitis: from the perspective of intestinal mucosal barrier.Front Med (Lausanne). 2024 Jan 5;10:1333531. doi: 10.3389/fmed.2023.1333531. eCollection 2023. Front Med (Lausanne). 2024. PMID: 38249980 Free PMC article. Review.
-
CDK8 and CDK19 regulate intestinal differentiation and homeostasis via the chromatin remodeling complex SWI/SNF.J Clin Invest. 2022 Oct 17;132(20):e158593. doi: 10.1172/JCI158593. J Clin Invest. 2022. PMID: 36006697 Free PMC article.
-
Organization of the human intestine at single-cell resolution.Nature. 2023 Jul;619(7970):572-584. doi: 10.1038/s41586-023-05915-x. Epub 2023 Jul 19. Nature. 2023. PMID: 37468586 Free PMC article.
-
Basic helix-loop-helix transcription factors and enteroendocrine cell differentiation.Diabetes Obes Metab. 2011 Oct;13 Suppl 1(0 1):5-12. doi: 10.1111/j.1463-1326.2011.01438.x. Diabetes Obes Metab. 2011. PMID: 21824251 Free PMC article. Review.
References
-
- Akazawa C, Ishibashi M, Shimizu C, Nakanishi S, Kageyama R. A mammalian helix-loop-helix factor structurally related to the product of Drosophila proneural gene atonal is a positive transcriptional regulator expressed in the developing nervous system. J Biol Chem. 1995;270:8730–8. - PubMed
-
- Apelqvist A, Li H, Sommer L, Beatus P, Anderson DJ, Honjo T, Hrabe de Angelis M, Lendahl U, Edlund H. Notch signalling controls pancreatic cell differentiation. Nature. 1999;400:877–81. - PubMed
-
- Barker N, van Es JH, Kuipers J, Kujala P, van den Born M, Cozijnsen M, Haegebarth A, Korving J, Begthel H, Peters PJ, Clevers H. Identification of stem cells in small intestine and colon by marker gene Lgr5. Nature. 2007;449:1003–7. - PubMed
-
- Bjerknes M, Cheng H. Gastrointestinal stem cells. II. Intestinal stem cells. Am J Physiol Gastrointest Liver Physiol. 2005;289:G381–7. - PubMed
-
- Bjerknes M, Cheng H. Neurogenin 3 and the enteroendocrine cell lineage in the adult mouse small intestinal epithelium. Dev Biol. 2006;300:722–35. - PubMed
Publication types
MeSH terms
Substances
Grants and funding
LinkOut - more resources
Full Text Sources
Other Literature Sources
Medical
Molecular Biology Databases
Miscellaneous

