. 2011 Feb;31(2):514-26.
doi: 10.1038/jcbfm.2010.121. Epub 2010 Aug 4.

Metabolic acidosis induced by Plasmodium falciparum intraerythrocytic stages alters blood-brain barrier integrity

Affiliations

Metabolic acidosis induced by Plasmodium falciparum intraerythrocytic stages alters blood-brain barrier integrity

Sergine Zougbédé et al. J Cereb Blood Flow Metab. 2011 Feb.

Abstract

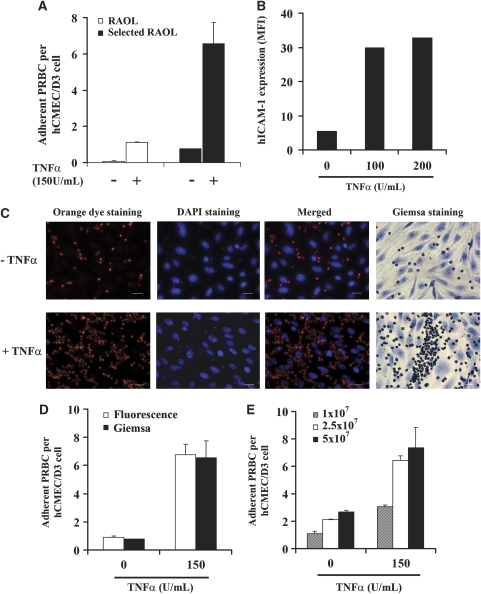
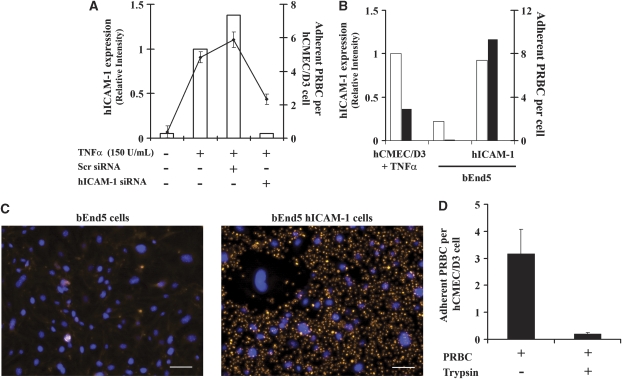
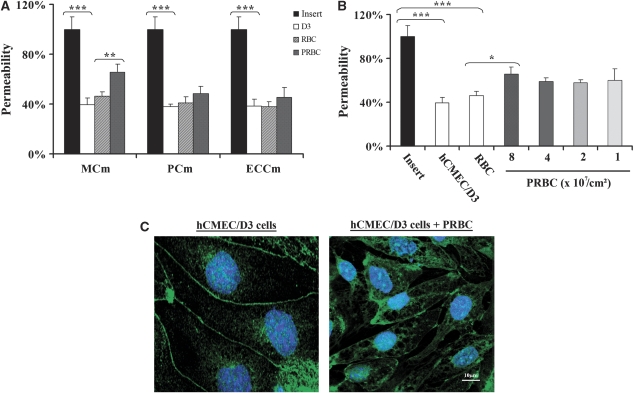
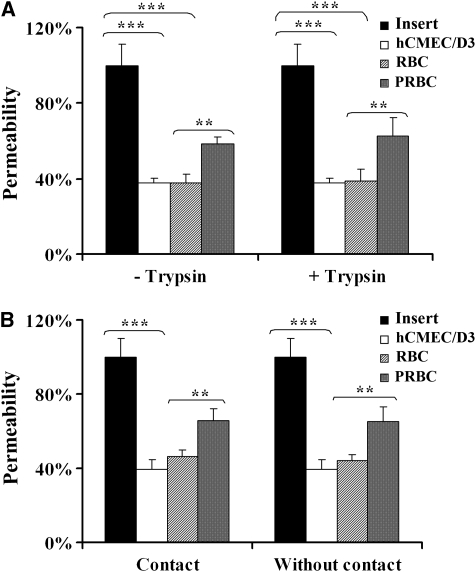
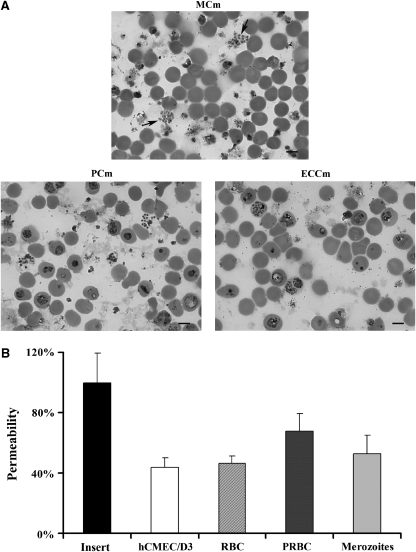
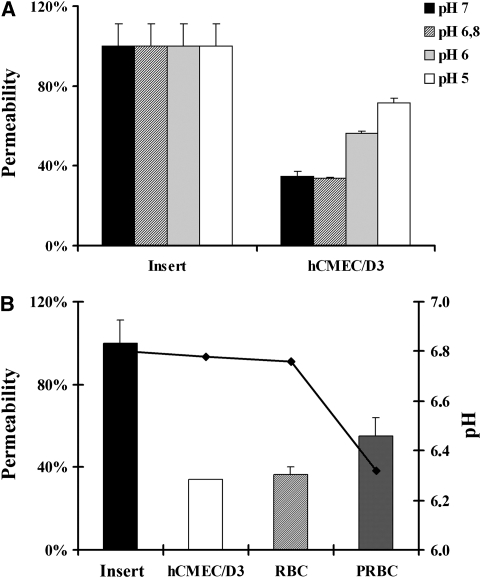
The pathogenesis of cerebral malaria (CM) remains largely unknown. There is growing evidence that combination of both parasite and host factors could be involved in blood-brain barrier (BBB) breakdown. However, lack of adequate in vitro model of human BBB so far hampered molecular studies. In this article, we propose the use of hCMEC/D3 cells, a well-established human cerebral microvascular endothelial cell (EC) line, to study BBB breakdown induced by Plasmodium falciparum-parasitized red blood cells and environmental conditions. We show that coculture of parasitized erythrocytes with hCMEC/D3 cells induces cell adhesion and paracellular permeability increase, which correlates with disorganization of zonula occludens protein 1 expression pattern. Permeability increase and modification of tight junction proteins distribution are cytoadhesion independent. Finally, we show that permeability of hCMEC/D3 cell monolayers is mediated through parasite induced metabolic acidosis, which in turns correlates with apoptosis of parasitized erythrocytes. This new coculture model represents a very useful tool, which will improve the knowledge of BBB breakdown and the development of adjuvant therapies, together with antiparasitic drugs.


Figures

Figure 1
Figure 1
Plasmodium falciparum-parasitized red blood cells (RBCs) adhere to hCMEC/D3 cells. (A) In all, 5 × 10⁷/cm2 P. falciparum RAOL isolate parasitized RBCs (PRBCs) (60% parasitemia and 5% hematocrit) were cocultured for 1 hour with hCMEC/D3 cells, stimulated or not with 150 U/mL of tumor necrosis factor (TNFα). White bars denote cytoadherence of nonselected parasite isolate and black bars denote cytoadherence of selected RAOL isolate. (B) Flow cytometry analysis of human intercellular adhesion molecule 1 (hICAM-1) expression in hCMEC/D3 cell line, stimulated or not with TNFα for 24 hours. MFI, mean fluorescence intensity. (C) Fluorescent staining of PRBCs (orange dye) and hCMEC/D3 cells stimulated or not with TNFα for 24 hours (DAPI staining). Emission wavelengths of the orange dye and DAPI were 561 and 460 nm, respectively. Classical Giemsa staining is also shown. The scale represents 20 μm. (D) In all, 5 × 10⁷/cm2 PRBCs and hCMEC/D3 cells were cocultured as described in section A and the cytoadherence was measured using the new fluorescence and Giemsa protocols. White bars denote cytoadherence quantification with the new fluorescence method and black bars denote cytoadherence quantification with the Giemsa staining. (E) Different doses of P. falciparum selected RAOL isolate PRBCs were cocultured with hCMEC/D3 cells, stimulated or not with TNFα for 24 hours, and PRBCs cytoadherence was assessed. Hatched bars represent cytoadherence quantification with a parasite load of 1 × 10⁷/cm2 (60% parasitemia and 1% hematocrit), 2.5 × 10⁷/cm2 (60% parasitemia and 2.5% hematocrit) for white bars, and 5 × 10⁷/cm2 (60% parasitemia and 5% hematocrit) for black bars (s.d. is shown for n=3). DAPI, 4′,6-diamidino-2-phenylindole.
Figure 2
Figure 2
Plasmodium falciparum RAOL adhere to hCMEC/D3 cells mainly through human intercellular adhesion molecule 1 (hICAM-1). (A) The hCMEC/D3 cells were treated or not with 20 nmol/L of SCR siRNA or hICAM-1 siRNA for 48 hours and then hICAM-1 expression, as well as 2.5 × 10⁷/cm2 (60% parasitemia and 2.5% hematocrit) parasitized red blood cells (PRBCs) adherence, was analyzed. The black line represents the adherence of PRBCs to hCMEC/D3 cells. Flow cytometry data are represented as the relative intensity with respect to tumor necrosis factor (TNFα)-stimulated hCMEC/D3 cells. (B) Mouse bEnd5 cells were transduced with lentiviral vectors bearing hICAM-1 sequence. The hICAM-1 expression in transduced cells (white bars), as well as PRBCs cytoadherence (2.5 × 10⁷/cm2) (black bars), is shown. Flow cytometry data are represented as the relative intensity with respect to TNFα-stimulated hCMEC/D3 cells. (C) In all, 2.5 × 10⁷/cm2 PRBCs were cocultured with control bEnd5 mouse cells or hICAM-1-transduced bEnd5 cells. Cytoadherence was detected by fluorescence, using a DMI 4000B Leica microscope, and imaged with an AxioCam MRc5 Zeiss camera. Blue staining, cell nuclei, Orange staining, PRBCs. The bar represents 50 μm. (D) In all, 2.5 × 10⁷/cm2 PRBCs were treated or not with trypsin and then cocultured with hCMEC/D3 cells. After 20 hours of coculture, cytoadherence was estimated. SCR, scramble.
Figure 3
Figure 3
Effect of Plasmodium falciparum RAOL isolate parasitized red blood cells (PRBCs) on hCMEC/D3 cell permeability. (A) The hCMEC/D3 cells were cultured or cocultured with RBCs or 8 × 10⁷/cm2 PRBCs (50% parasitemia and 2.5% hematocrit) in 12 mm-collagen/70% ethanol-coated Millicell cell culture insert in the presence of different culture media for 20 hours, and then permeability was estimated. Permeability is represented as the percentage of Lucifer Yellow dye in the abluminal compartment compared with the insert. Black bars denote permeability quantification with the insert alone; white bars denote permeability quantification with hCMEC/D3 cells alone; hatched bars denote permeability quantification with RBCs and gray bars denote permeability quantification with PRBCs. MCm, modified culture medium; PCm, parasite culture medium; ECCm, endothelial cell culture medium. (B) The hCMEC/D3 cells were cultured or cocultured with RBCs or PRBCs at different parasitemias (1, 2, 4, and 8 × 10⁷/cm2; hematocrit 2.5%) in MCm for 20 hours. Permeability was estimated as above. *P<0.05, **P<0.01, and ***P<0.001. (C) Immunostaining of hCMEC/D3 cells. Cells were cultured alone or cocultured with 2.5 × 10⁷/cm2 (50% parasitemia and 2.5% hematocrit) PRBCs and samples were stained with an anti-ZO1 antibody, followed by an Alexa Fluor 488 (Eugene, OR, USA)-conjugated secondary antibody and DAPI. Cells were then analyzed by confocal microscopy. The bar represents 10 μm. Similar results were obtained in three independent experiments. DAPI, 4′,6-diamidino-2-phenylindole.
Figure 4
Figure 4
Evaluation of cytoadherence involvement in hCMEC/D3 cells permeability. (A) Parasitized red blood cells (PRBCs) (8 × 10⁷/cm2, equivalent to 50% parasitemia and 2.5% hematocrit) were trypsinized or not and cocultured with hCMEC/D3 cells for 20 hours in modified culture medium (MCm). Percentage of cell permeability was estimated as in previous figures. (B) The hCMEC/D3 cells were cultured in contact or not with RBCs or PRBCs (8 × 10⁷/cm2) for 20 hours and then permeability was estimated as above. Black bars denote permeability quantification with the insert alone; white bars denote permeability quantification with hCMEC/D3 cells alone; hatched bars denote permeability quantification with RBCs; and gray bars denote permeability quantification with PRBCs. *P<0.05, **P<0.01, and ***P<0.001.
Figure 5
Figure 5
Effect of Plasmodium falciparum merozoites in endothelial cell (EC) permeability. (A) The hCMEC/D3 cells and 8 × 10⁷/cm2 parasitized red blood cells (PRBCs) (50% parasitemia and 2.5% hematocrit) were cocultured in the different media. After 20 hours of coculture, PRBCs smears were performed, stained with Giemsa and then analyzed by microscopy. Arrows show the presence of free merozoites in modified culture medium (MCm). Similar results were obtained in three independent experiments. The bar represents 5 μm. (B) The hCMEC/D3 cells were cultured or cocultured with RBCs, PRBCs (8 × 10⁷/cm2) or merozoites in MCm for 20 hours. Permeability was estimated as in previous experiments (s.d. is shown for n=3).
Figure 6
Figure 6
Evaluation of parasitized red blood cells (PRBCs) soluble factors release and viability on cell permeability. (A) The PRBCs (8 × 10⁷/cm2, equivalent to 50% parasitemia and 2.5% hematocrit) were cultured for 20 hours in different culture media and parasite lactate deshydrogenase was estimated (s.d. is shown for n=3). (B) The PRBCs (8 × 10⁷/cm2) were cultured in parasite culture medium (PCm), EC culture medium (ECCm), and modified culture medium (MCm) for 20 hours. To analyze apoptosis, PRBCs were harvested, diluted in ice-cold-binding buffer, stained with annexin V and propidium iodide, and analyzed by flow cytometry. Similar results were obtained in two independent experiments.
Figure 7
Figure 7
Effect of the environmental pH on endothelial cell (EC) permeability. (A) The hCMEC/D3 cells were cultured for 20 hours in modified culture medium (MCm) at different pH. Black bars denote pH medium at 7; hatched bars denote pH medium at 6.8 (MCm); gray bars denote pH medium at 6; and white bars denote pH medium at 5 (s.d. is shown for n=3). (B) The EC permeability and pH after 20 hours of hCMEC/D3 culture alone or in coculture with parasitized red blood cells (PRBCs) (8 × 10⁷/cm2, equivalent to 50% parasitemia and 2.5% hematocrit). The bars correspond to permeability measurements and line corresponds to the pH measurements obtained in the different culture conditions.

Similar articles

Cited by

References

    1. Afonso PV, Ozden S, Cumont MC, Seilhean D, Cartier L, Rezaie P, Mason S, Lambert S, Huerre M, Gessain A, Couraud PO, Pique C, Ceccaldi PE, Romero IA. Alteration of blood-brain barrier integrity by retroviral infection. PLoS Pathog. 2008;4:e1000205. - PMC - PubMed
    1. Aird WC. Phenotypic heterogeneity of the endothelium: I. Structure, function, and mechanisms. Circ Res. 2007;100:158–173. - PubMed
    1. Boonpucknavig V, Boonpucknavig S, Udomsangpetch R, Nitiyanant P. An immunofluorescence study of cerebral malaria. A correlation with histopathology. Arch Pathol Lab Med. 1990;114:1028–1034. - PubMed
    1. Brown H, Hien TT, Day N, Mai NT, Chuong LV, Chau TT, Loc PP, Phu NH, Bethell D, Farrar J, Gatter K, White N, Turner G. Evidence of blood-brain barrier dysfunction in human cerebral malaria. Neuropathol Appl Neurobiol. 1999a;25:331–340. - PubMed
    1. Brown H, Rogerson S, Taylor T, Tembo M, Mwenechanya J, Molyneux M, Turner G. Blood-brain barrier function in cerebral malaria in Malawian children. Am J Trop Med Hyg. 2001;64:207–213. - PubMed

Publication types

MeSH terms