

Microfluidic sorting and multimodal typing of cancer cells in self-assembled magnetic arrays
- PMID: 20679245
- PMCID: PMC2930475
- DOI: 10.1073/pnas.1001515107
Microfluidic sorting and multimodal typing of cancer cells in self-assembled magnetic arrays
Abstract
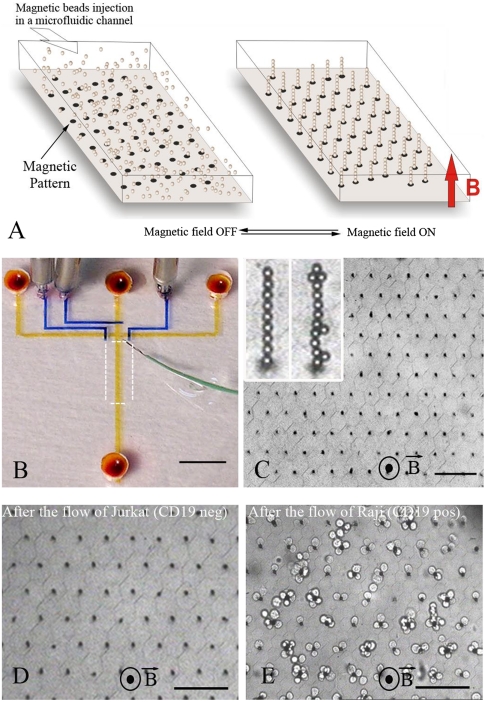
We propose a unique method for cell sorting, "Ephesia," using columns of biofunctionalized superparamagnetic beads self-assembled in a microfluidic channel onto an array of magnetic traps prepared by microcontact printing. It combines the advantages of microfluidic cell sorting, notably the application of a well controlled, flow-activated interaction between cells and beads, and those of immunomagnetic sorting, notably the use of batch-prepared, well characterized antibody-bearing beads. On cell lines mixtures, we demonstrated a capture yield better than 94%, and the possibility to cultivate in situ the captured cells. A second series of experiments involved clinical samples--blood, pleural effusion, and fine needle aspirates--issued from healthy donors and patients with B-cell hematological malignant tumors (leukemia and lymphoma). The immunophenotype and morphology of B-lymphocytes were analyzed directly in the microfluidic chamber, and compared with conventional flow cytometry and visual cytology data, in a blind test. Immunophenotyping results using Ephesia were fully consistent with those obtained by flow cytometry. We obtained in situ high resolution confocal three-dimensional images of the cell nuclei, showing intranuclear details consistent with conventional cytological staining. Ephesia thus provides a powerful approach to cell capture and typing allowing fully automated high resolution and quantitative immunophenotyping and morphological analysis. It requires at least 10 times smaller sample volume and cell numbers than cytometry, potentially increasing the range of indications and the success rate of microbiopsy-based diagnosis, and reducing analysis time and cost.
Conflict of interest statement
Conflict of interest statement: Part of the methodology described is dependent from CNRS patent WO9823379 and Curie Institute patent application PCT/FR2009/051942.
Figures
Similar articles
-
Simplified fluid-structure coupled analysis of particle movement for designing of microfluidic cell sorter.Annu Int Conf IEEE Eng Med Biol Soc. 2015;2015:3229-32. doi: 10.1109/EMBC.2015.7319080. Annu Int Conf IEEE Eng Med Biol Soc. 2015. PMID: 26736980
-
Hydrodynamic gating valve for microfluidic fluorescence-activated cell sorting.Anal Chim Acta. 2010 Mar 17;663(1):1-6. doi: 10.1016/j.aca.2010.01.046. Epub 2010 Feb 1. Anal Chim Acta. 2010. PMID: 20172088
-
A micropillar-integrated smart microfluidic device for specific capture and sorting of cells.Electrophoresis. 2007 Dec;28(24):4713-22. doi: 10.1002/elps.200700212. Electrophoresis. 2007. PMID: 18008303
-
Microfluidic: an innovative tool for efficient cell sorting.Methods. 2012 Jul;57(3):297-307. doi: 10.1016/j.ymeth.2012.07.002. Epub 2012 Jul 11. Methods. 2012. PMID: 22796377 Review.
-
Microfluidic blood cell sorting: now and beyond.Small. 2014 May 14;10(9):1687-703. doi: 10.1002/smll.201302907. Epub 2014 Feb 10. Small. 2014. PMID: 24515899 Free PMC article. Review.
Cited by
-
Advances in microfluidic materials, functions, integration, and applications.Chem Rev. 2013 Apr 10;113(4):2550-83. doi: 10.1021/cr300337x. Epub 2013 Feb 14. Chem Rev. 2013. PMID: 23410114 Free PMC article. Review. No abstract available.
-
UV activation of polymeric high aspect ratio microstructures: ramifications in antibody surface loading for circulating tumor cell selection.Lab Chip. 2014 Jan 7;14(1):106-17. doi: 10.1039/c3lc50618e. Lab Chip. 2014. PMID: 23900277 Free PMC article.
-
Cancer Stem Cell Plasticity - A Deadly Deal.Front Mol Biosci. 2020 Apr 30;7:79. doi: 10.3389/fmolb.2020.00079. eCollection 2020. Front Mol Biosci. 2020. PMID: 32426371 Free PMC article. Review.
-
Wedge-shaped microfluidic chip for circulating tumor cells isolation and its clinical significance in gastric cancer.J Transl Med. 2018 May 23;16(1):139. doi: 10.1186/s12967-018-1521-8. J Transl Med. 2018. PMID: 29792200 Free PMC article.
-
Enrichment and mutation detection of circulating tumor cells from blood samples.Oncol Rep. 2018 Jun;39(6):2537-2544. doi: 10.3892/or.2018.6342. Epub 2018 Mar 30. Oncol Rep. 2018. PMID: 29620284 Free PMC article.
References
-
- Hortobagyi GN. Trastuzumab in the treatment of breast cancer. N Engl J Med. 2005;353:1734–1736. - PubMed
-
- Bonnet D, Dick JE. Human acute myeloid leukemia is organized as a hierarchy that originates from a primitive hematopoietic cell. Nat Med. 1997;3:730–737. - PubMed
-
- Pachmann K, et al. Monitoring the response of circulating epithelial tumor cells to adjuvant chemotherapy in breast cancer allows detection of patients at risk of early relapse. J Clin Oncol. 2008;26:1208–1215. - PubMed
-
- Allard WJ, et al. Tumor cells circulate in the peripheral blood of all major carcinomas but not in healthy subjects or patients with nonmalignant diseases. Clin Cancer Res. 2004;10:6897–6904. - PubMed
-
- Jorgensen JL. State of the art symposium: flow cytometry in the diagnosis of lymphoproliferative disorders by fine-needle aspiration. Cancer. 2005;105:443–451. - PubMed
Publication types
MeSH terms
LinkOut - more resources
Full Text Sources
Other Literature Sources
