

Comparison study of microarray meta-analysis methods
- PMID: 20678237
- PMCID: PMC2922198
- DOI: 10.1186/1471-2105-11-408
Comparison study of microarray meta-analysis methods
Abstract
Background: Meta-analysis methods exist for combining multiple microarray datasets. However, there are a wide range of issues associated with microarray meta-analysis and a limited ability to compare the performance of different meta-analysis methods.
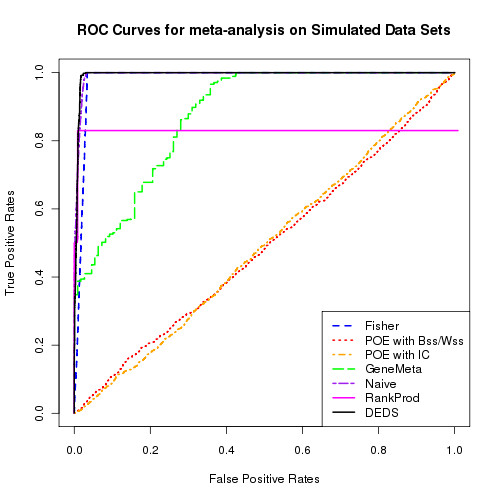
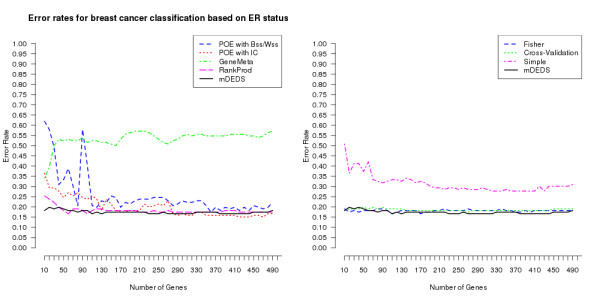
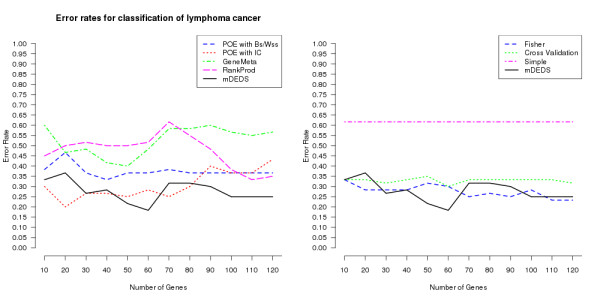
Results: We compare eight meta-analysis methods, five existing methods, two naive methods and a novel approach (mDEDS). Comparisons are performed using simulated data and two biological case studies with varying degrees of meta-analysis complexity. The performance of meta-analysis methods is assessed via ROC curves and prediction accuracy where applicable.
Conclusions: Existing meta-analysis methods vary in their ability to perform successful meta-analysis. This success is very dependent on the complexity of the data and type of analysis. Our proposed method, mDEDS, performs competitively as a meta-analysis tool even as complexity increases. Because of the varying abilities of compared meta-analysis methods, care should be taken when considering the meta-analysis method used for particular research.
Figures
Similar articles
-
Robust microarray meta-analysis identifies differentially expressed genes for clinical prediction.ScientificWorldJournal. 2012;2012:989637. doi: 10.1100/2012/989637. Epub 2012 Dec 18. ScientificWorldJournal. 2012. PMID: 23365541 Free PMC article.
-
Identification of suitable genes contributes to lung adenocarcinoma clustering by multiple meta-analysis methods.Clin Respir J. 2016 Sep;10(5):631-46. doi: 10.1111/crj.12271. Epub 2015 Mar 3. Clin Respir J. 2016. PMID: 25619939
-
Combining multiple microarray studies using bootstrap meta-analysis.Annu Int Conf IEEE Eng Med Biol Soc. 2008;2008:5660-3. doi: 10.1109/IEMBS.2008.4650498. Annu Int Conf IEEE Eng Med Biol Soc. 2008. PMID: 19164001 Free PMC article.
-
Meta-analysis of microarray results: challenges, opportunities, and recommendations for standardization.Gene. 2007 Oct 15;401(1-2):12-8. doi: 10.1016/j.gene.2007.06.016. Epub 2007 Jul 3. Gene. 2007. PMID: 17651921 Free PMC article. Review.
-
Key issues in conducting a meta-analysis of gene expression microarray datasets.PLoS Med. 2008 Sep 30;5(9):e184. doi: 10.1371/journal.pmed.0050184. Epub 2008 Sep 2. PLoS Med. 2008. PMID: 18767902 Free PMC article. Review.
Cited by
-
Methods to increase reproducibility in differential gene expression via meta-analysis.Nucleic Acids Res. 2017 Jan 9;45(1):e1. doi: 10.1093/nar/gkw797. Epub 2016 Sep 14. Nucleic Acids Res. 2017. PMID: 27634930 Free PMC article.
-
Analyzing illumina gene expression microarray data from different tissues: methodological aspects of data analysis in the metaxpress consortium.PLoS One. 2012;7(12):e50938. doi: 10.1371/journal.pone.0050938. Epub 2012 Dec 7. PLoS One. 2012. PMID: 23236413 Free PMC article.
-
Meta-analysis of transcriptomic responses to biotic and abiotic stress in tomato.PeerJ. 2018 Jul 17;6:e4631. doi: 10.7717/peerj.4631. eCollection 2018. PeerJ. 2018. PMID: 30038850 Free PMC article.
-
Leveraging Big Data to Transform Drug Discovery.Methods Mol Biol. 2019;1939:91-118. doi: 10.1007/978-1-4939-9089-4_6. Methods Mol Biol. 2019. PMID: 30848458 Free PMC article.
-
Gene expression analysis supports tumor threshold over 2.0 cm for T-category breast cancer.EURASIP J Bioinform Syst Biol. 2016 Feb 8;2016(1):6. doi: 10.1186/s13637-015-0034-5. eCollection 2016 Dec. EURASIP J Bioinform Syst Biol. 2016. PMID: 26900390 Free PMC article.
References
Publication types
MeSH terms
LinkOut - more resources
Full Text Sources
