

Functional divergence among CD103+ dendritic cell subpopulations following pulmonary poxvirus infection
- PMID: 20660207
- PMCID: PMC2937786
- DOI: 10.1128/JVI.00892-10
Functional divergence among CD103+ dendritic cell subpopulations following pulmonary poxvirus infection
Abstract
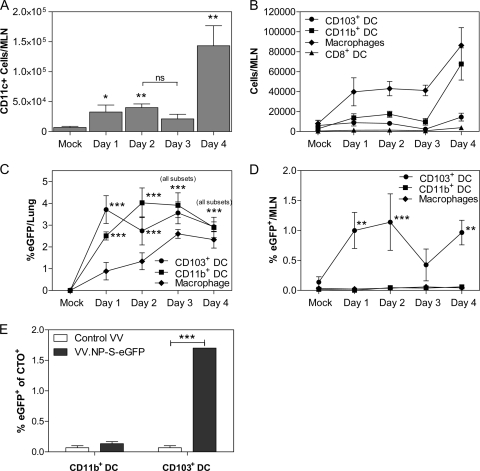
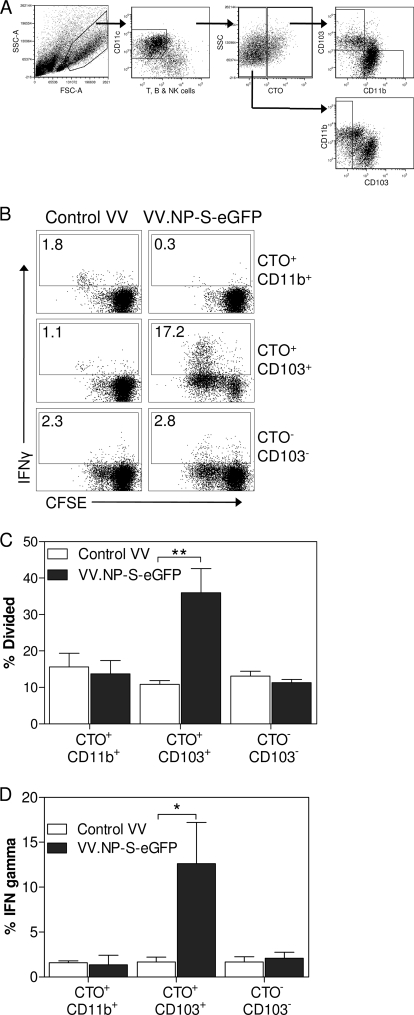
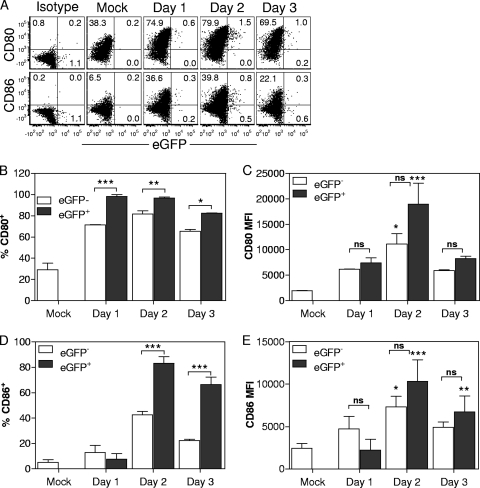
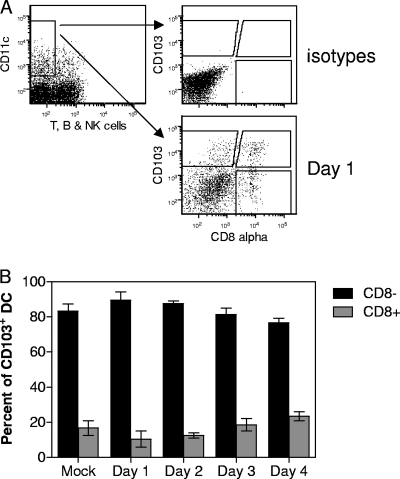
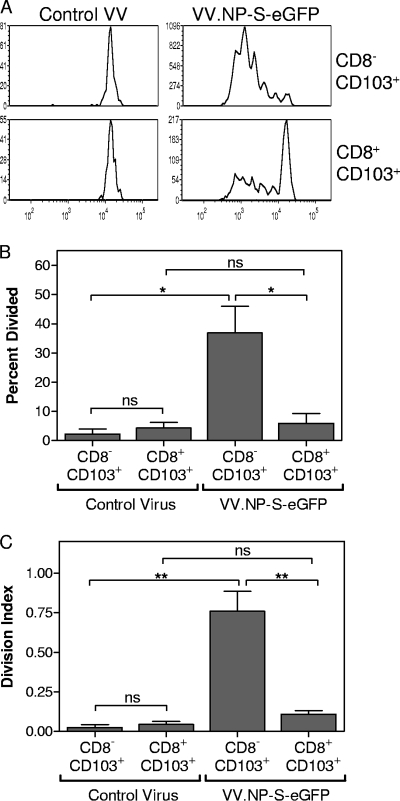
A large number of dendritic cell (DC) subsets have now been identified based on the expression of a distinct array of surface markers as well as differences in functional capabilities. More recently, the concept of unique subsets has been extended to the lung, although the functional capabilities of these subsets are only beginning to be explored. Of particular interest are respiratory DCs that express CD103. These cells line the airway and act as sentinels for pathogens that enter the lung, migrating to the draining lymph node, where they add to the already complex array of DC subsets present at this site. Here we assessed the contributions of these individual populations to the generation of a CD8(+) T-cell response following respiratory infection with poxvirus. We found that CD103(+) DCs were the most effective antigen-presenting cells (APC) for naive CD8(+) T-cell activation. Surprisingly, we found no evidence that lymph node-resident or parenchymal DCs could prime virus-specific cells. The increased efficacy of CD103(+) DCs was associated with the increased presence of viral antigen as well as high levels of maturation markers. Within the CD103(+) DCs, we observed a population that expressed CD8alpha. Interestingly, cells bearing CD8alpha were less competent for T-cell activation than their CD8alpha(-) counterparts. These data show that lung-migrating CD103(+) DCs are the major contributors to CD8(+) T-cell activation following poxvirus infection. However, the functional capabilities of cells within this population differ with the expression of CD8, suggesting that CD103(+) cells may be divided further into distinct subsets.
Figures
Similar articles
-
Batf3-Dependent Dendritic Cells Promote Optimal CD8 T Cell Responses against Respiratory Poxvirus Infection.J Virol. 2018 Jul 31;92(16):e00495-18. doi: 10.1128/JVI.00495-18. Print 2018 Aug 15. J Virol. 2018. PMID: 29875235 Free PMC article.
-
Liver-resident CD103+ dendritic cells prime antiviral CD8+ T cells in situ.J Immunol. 2015 Apr 1;194(7):3213-22. doi: 10.4049/jimmunol.1402622. Epub 2015 Feb 23. J Immunol. 2015. PMID: 25712214 Free PMC article.
-
Peripheral CD103+ dendritic cells form a unified subset developmentally related to CD8alpha+ conventional dendritic cells.J Exp Med. 2010 Apr 12;207(4):823-36. doi: 10.1084/jem.20091627. Epub 2010 Mar 29. J Exp Med. 2010. PMID: 20351058 Free PMC article.
-
Unique functions of splenic CD8alpha+ dendritic cells during infection with intracellular pathogens.Immunol Lett. 2007 Dec 15;114(2):66-72. doi: 10.1016/j.imlet.2007.09.007. Epub 2007 Oct 12. Immunol Lett. 2007. PMID: 17964665 Review.
-
The bloodline of CD8α(+) dendritic cells.Mol Cells. 2012 Sep;34(3):219-29. doi: 10.1007/s10059-012-0058-6. Epub 2012 Jul 4. Mol Cells. 2012. PMID: 22767247 Free PMC article. Review.
Cited by
-
A STATus report on DC development.J Leukoc Biol. 2012 Sep;92(3):445-59. doi: 10.1189/jlb.0212052. Epub 2012 May 1. J Leukoc Biol. 2012. PMID: 22550127 Free PMC article. Review.
-
Quantitative and qualitative deficits in neonatal lung-migratory dendritic cells impact the generation of the CD8+ T cell response.PLoS Pathog. 2014 Feb 13;10(2):e1003934. doi: 10.1371/journal.ppat.1003934. eCollection 2014 Feb. PLoS Pathog. 2014. PMID: 24550729 Free PMC article.
-
Heterogeneity of respiratory dendritic cell subsets and lymphocyte populations in inbred mouse strains.Respir Res. 2012 Oct 15;13(1):94. doi: 10.1186/1465-9921-13-94. Respir Res. 2012. PMID: 23066782 Free PMC article.
-
Monkeypox: disease epidemiology, host immunity and clinical interventions.Nat Rev Immunol. 2022 Oct;22(10):597-613. doi: 10.1038/s41577-022-00775-4. Epub 2022 Sep 5. Nat Rev Immunol. 2022. PMID: 36064780 Free PMC article. Review.
-
N1L is an ectromelia virus virulence factor and essential for in vivo spread upon respiratory infection.J Virol. 2011 Apr;85(7):3557-69. doi: 10.1128/JVI.01191-10. Epub 2011 Jan 26. J Virol. 2011. PMID: 21270149 Free PMC article.
References
-
- Banchereau, J., F. Briere, C. Caux, J. Davoust, S. Lebecque, Y. J. Liu, B. Pulendran, and K. Palucka. 2000. Immunobiology of dendritic cells. Annu. Rev. Immunol. 18:767-811. - PubMed
-
- Banchereau, J., and R. M. Steinman. 1998. Dendritic cells and the control of immunity. Nature 392:245-252. - PubMed
-
- Belz, G. T., C. M. Smith, D. Eichner, K. Shortman, G. Karupiah, F. R. Carbone, and W. R. Heath. 2004. Cutting edge: conventional CD8 alpha+ dendritic cells are generally involved in priming CTL immunity to viruses. J. Immunol. 172:1996-2000. - PubMed
-
- Belz, G. T., C. M. Smith, L. Kleinert, P. Reading, A. Brooks, K. Shortman, F. R. Carbone, and W. R. Heath. 2004. Distinct migrating and nonmigrating dendritic cell populations are involved in MHC class I-restricted antigen presentation after lung infection with virus. Proc. Natl. Acad. Sci. U. S. A. 101:8670-8675. - PMC - PubMed
Publication types
MeSH terms
Substances
Grants and funding
LinkOut - more resources
Full Text Sources
Research Materials
