Comparative Study
. 2010 Nov;139(5):1740-52.
doi: 10.1053/j.gastro.2010.07.041. Epub 2010 Jul 23.

Autophagy reduces acute ethanol-induced hepatotoxicity and steatosis in mice

Affiliations
Comparative Study

Autophagy reduces acute ethanol-induced hepatotoxicity and steatosis in mice

Wen-Xing Ding et al. Gastroenterology. 2010 Nov.

Abstract

Background & aims: Alcohol abuse is a major cause of liver injury. The pathologic features of alcoholic liver disease develop over prolonged periods, yet the cellular defense mechanisms against the detrimental effects of alcohol are not well understood. We investigated whether macroautophagy, an evolutionarily conserved cellular mechanism that is commonly activated in response to stress, could protect liver cells from ethanol toxicity.

Methods: Mice were acutely given ethanol by gavage. The effects of ethanol on primary hepatocytes and hepatic cell lines were also studied in vitro.

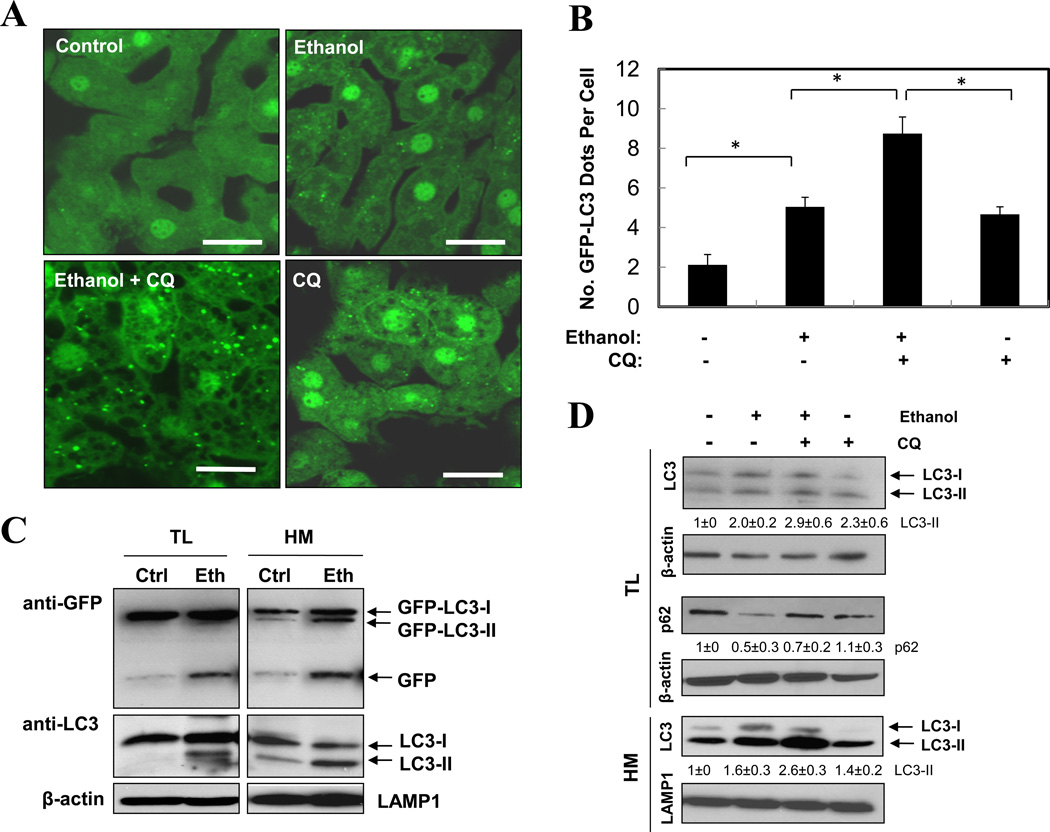
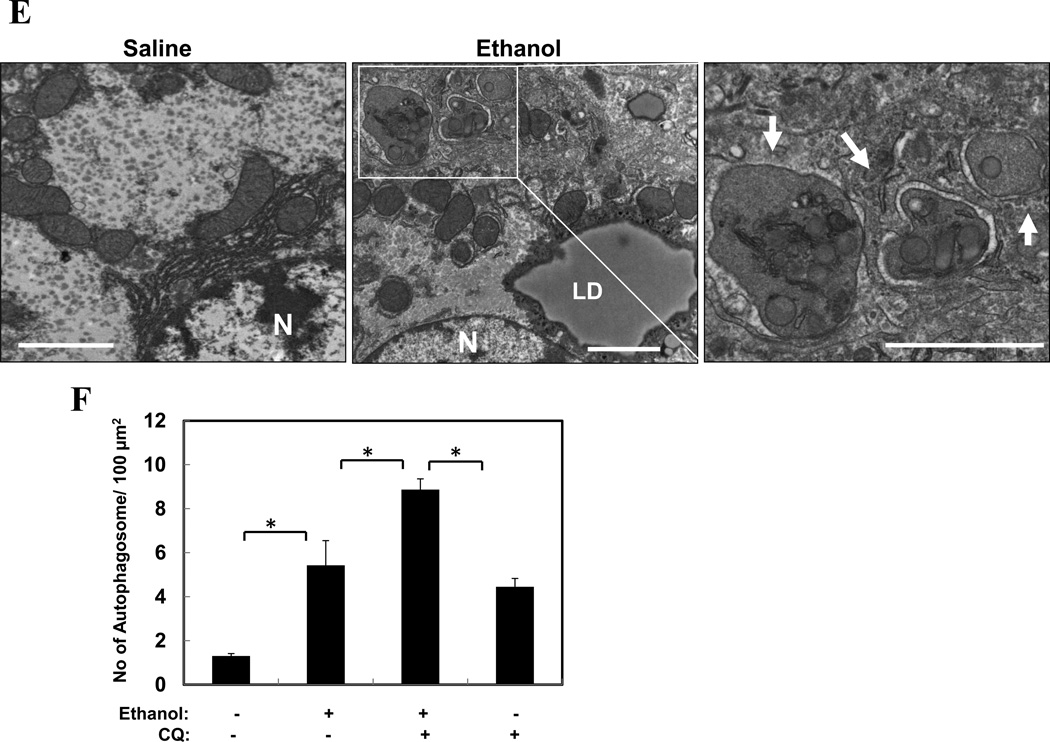
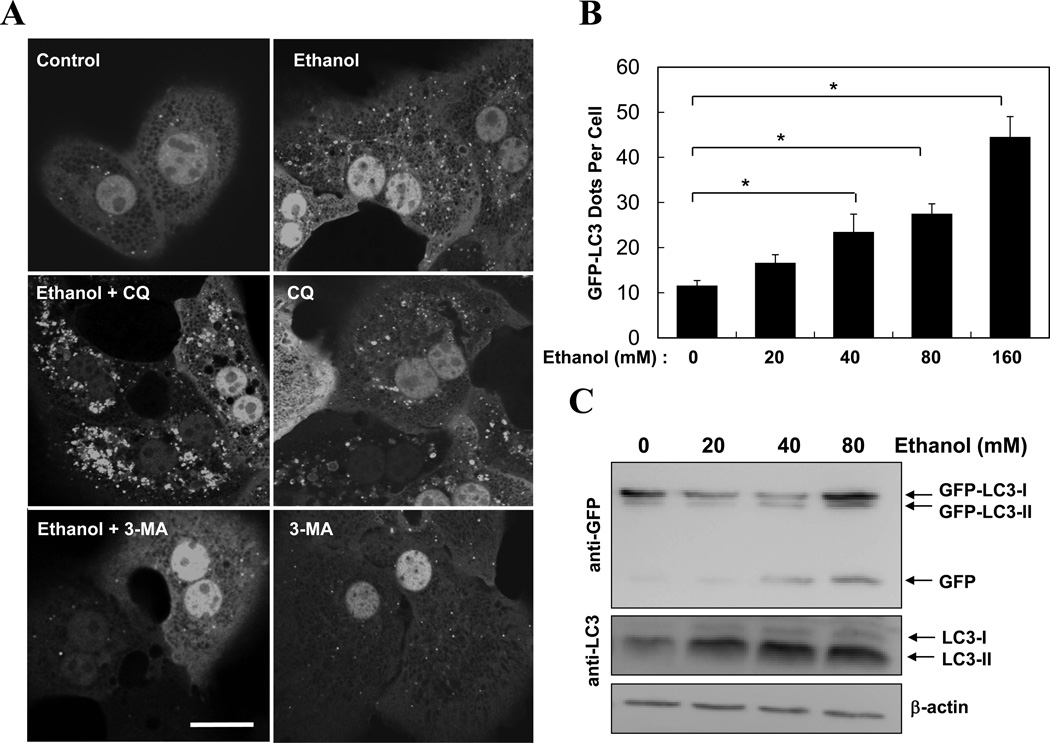
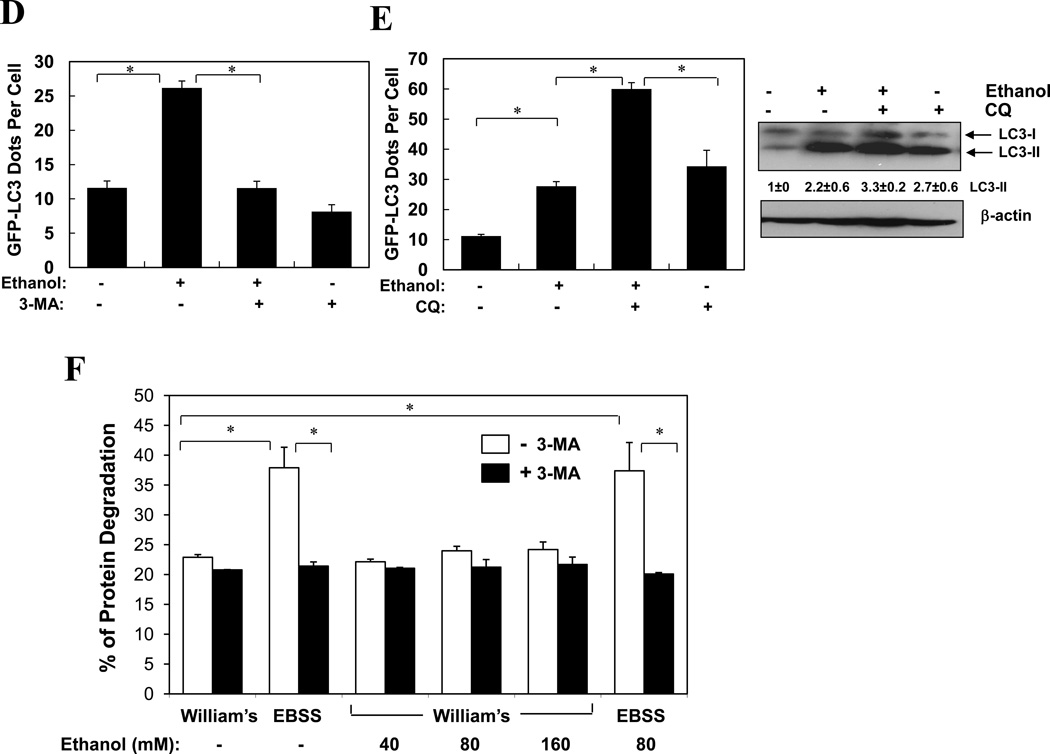
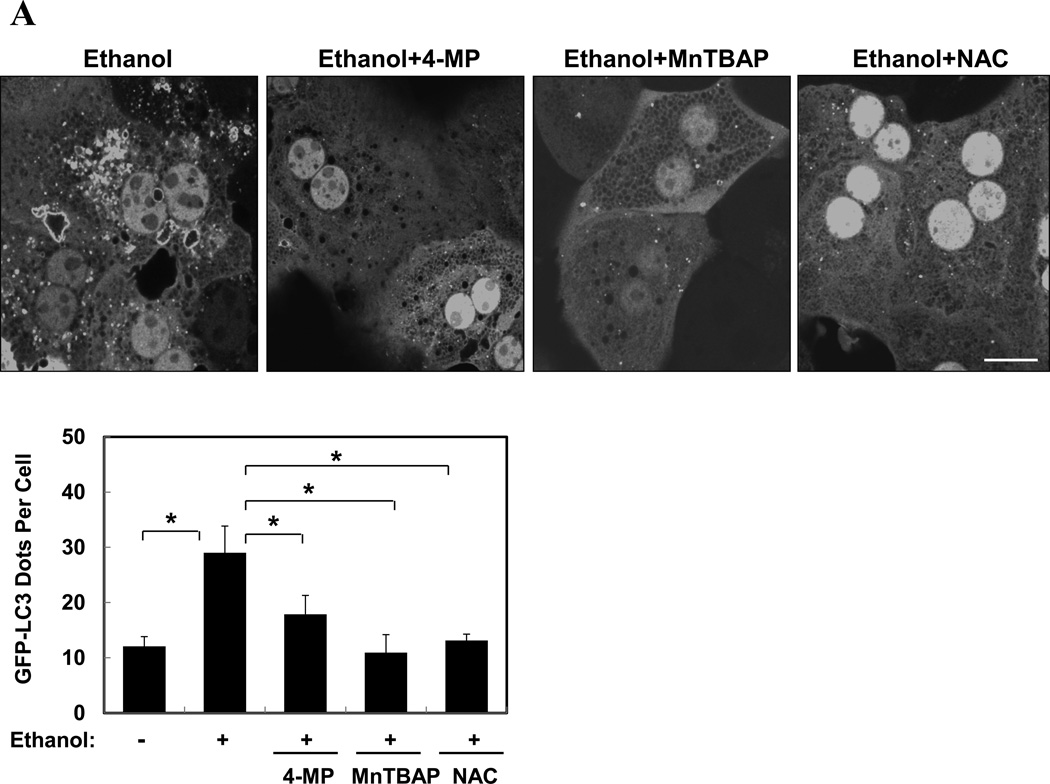
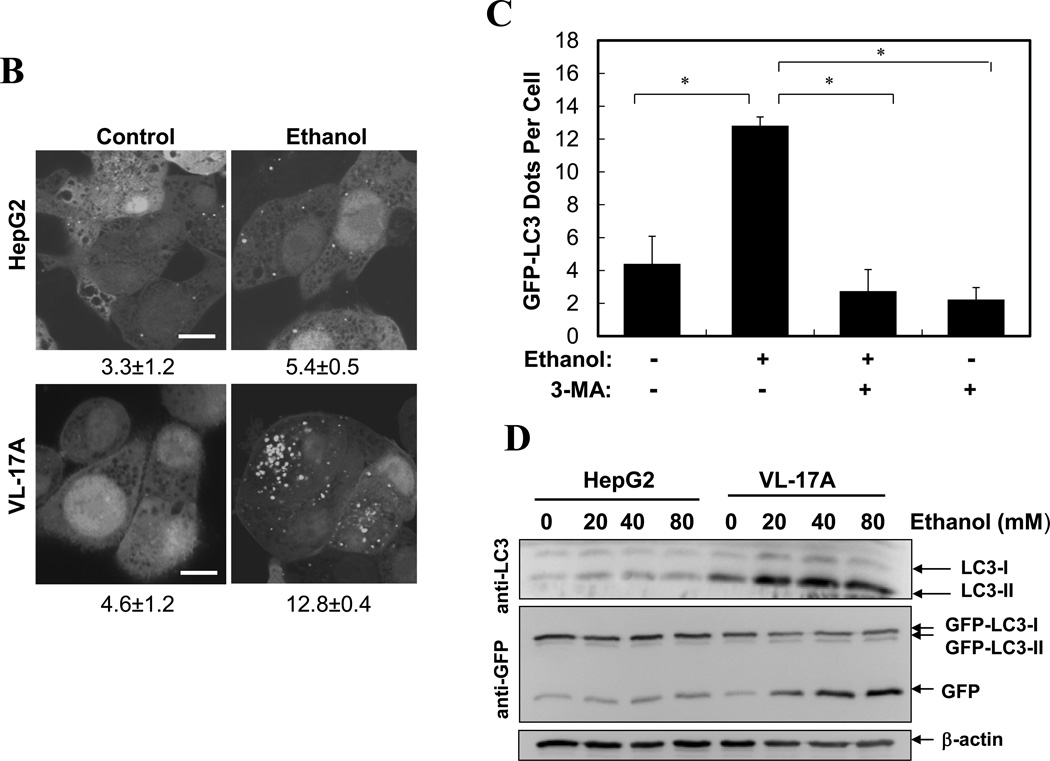
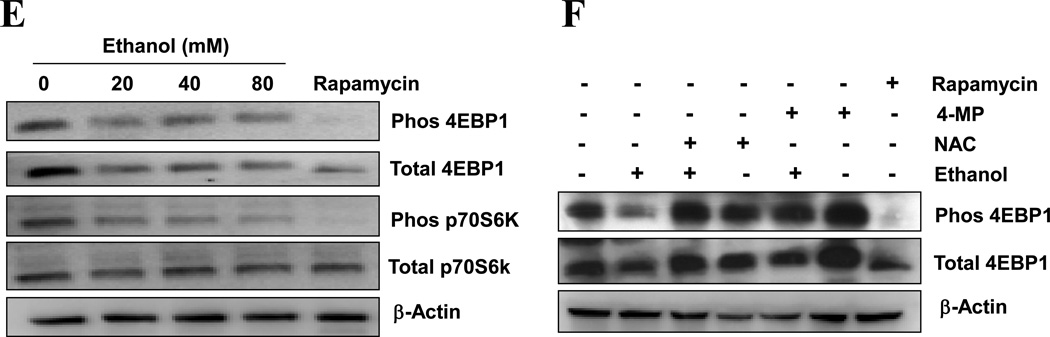
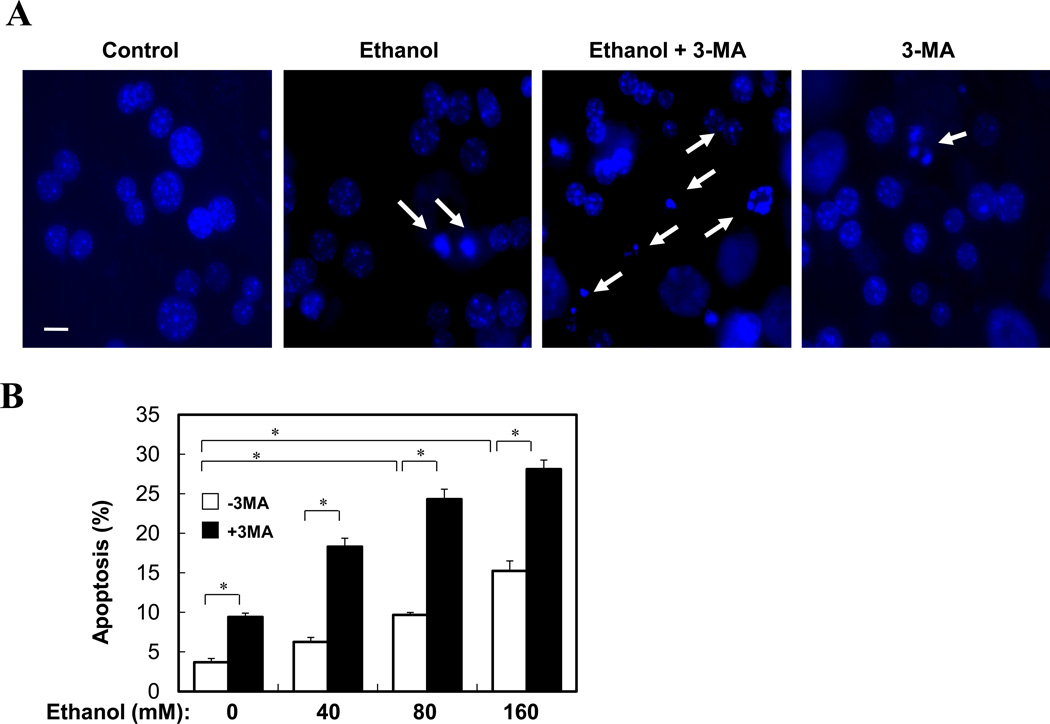
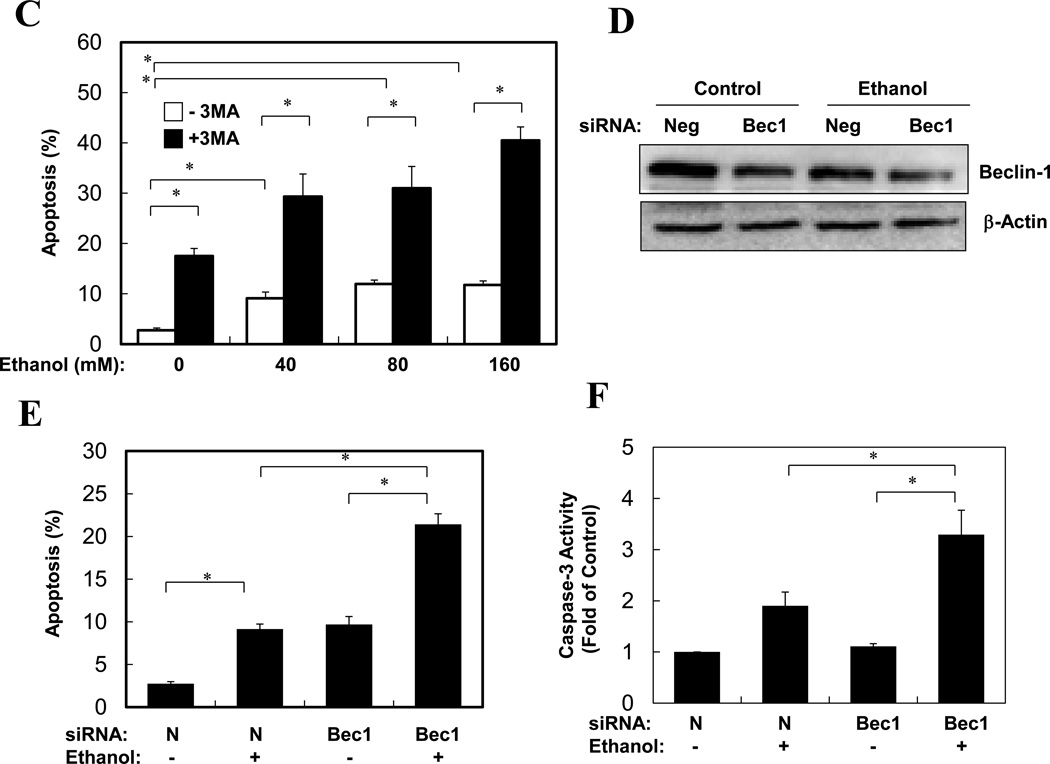
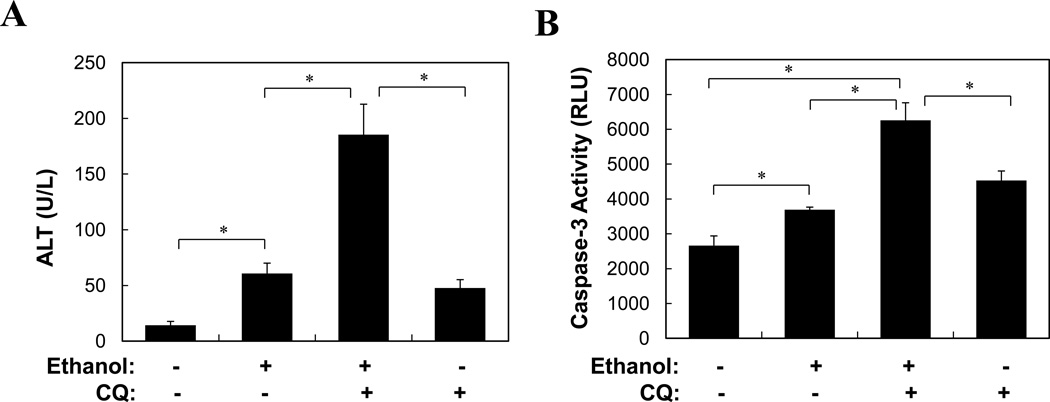
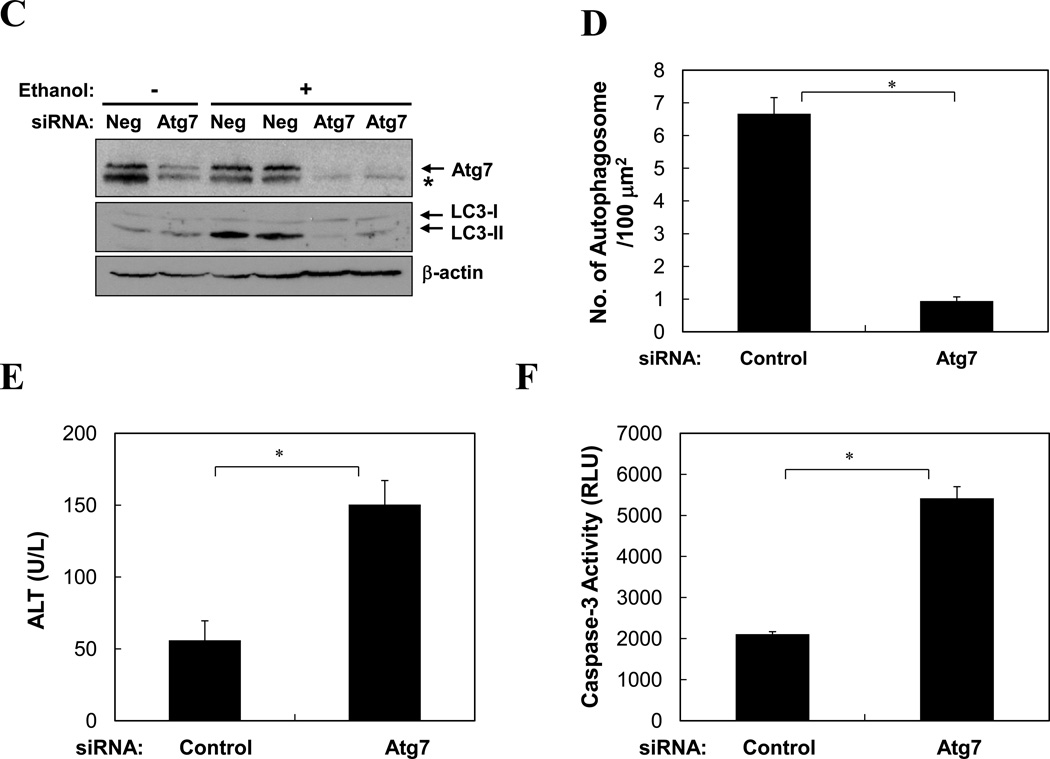
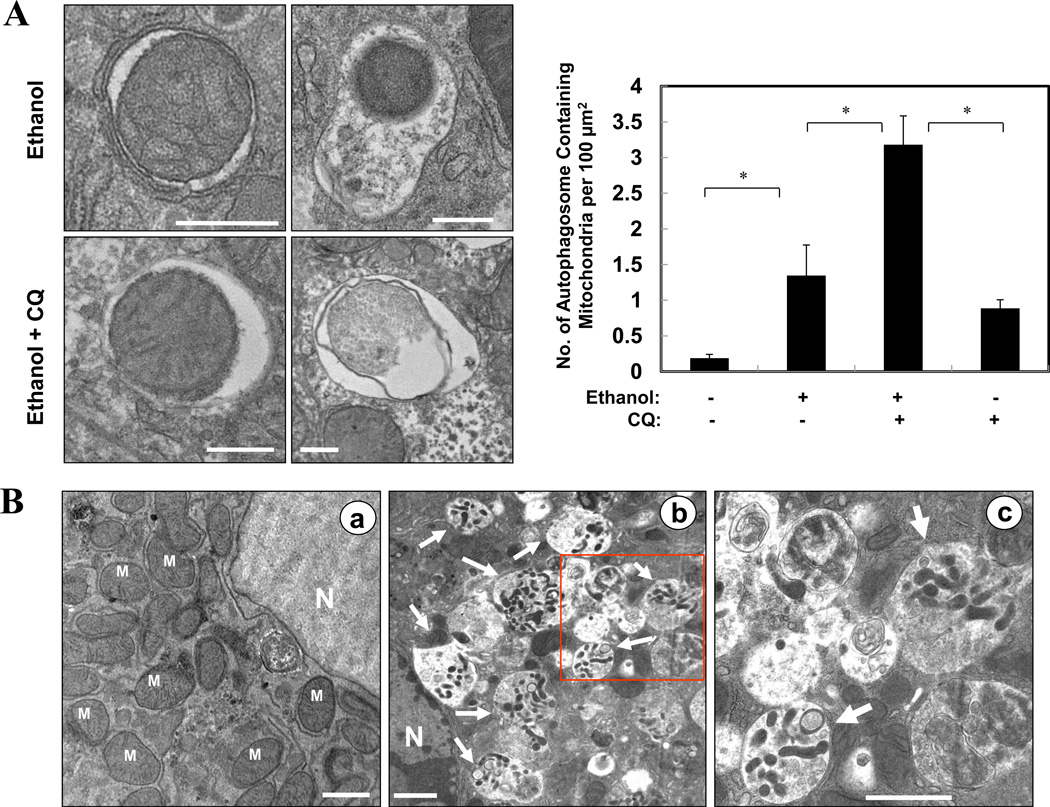
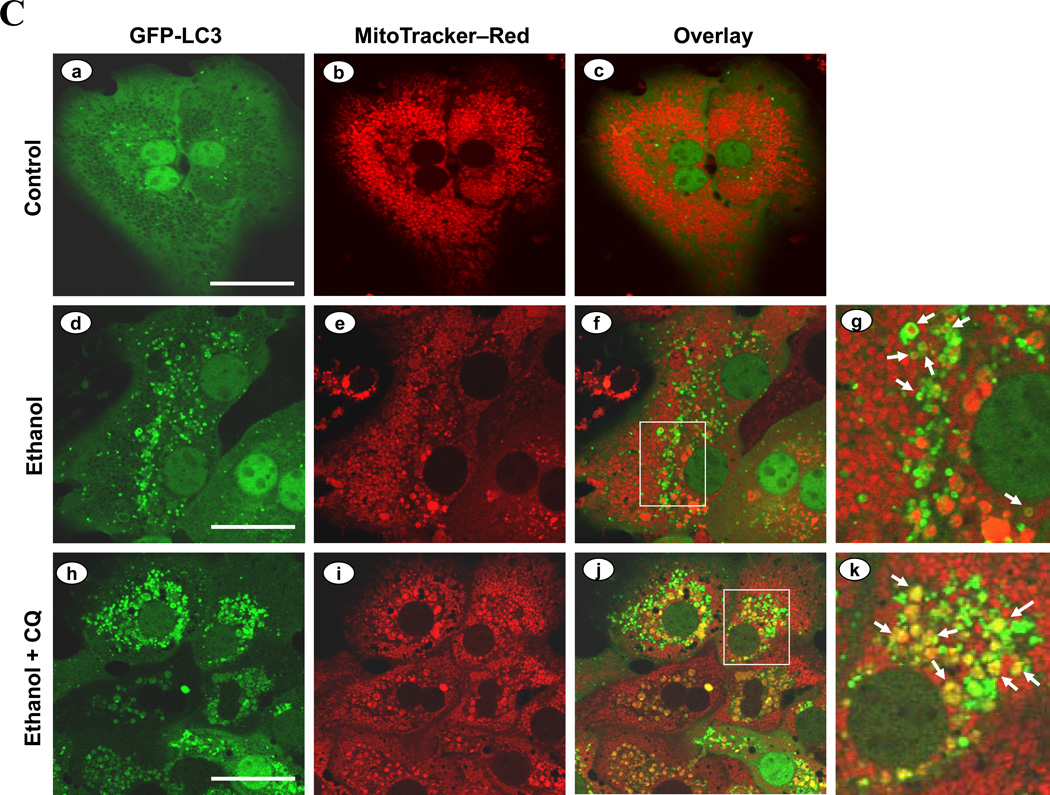
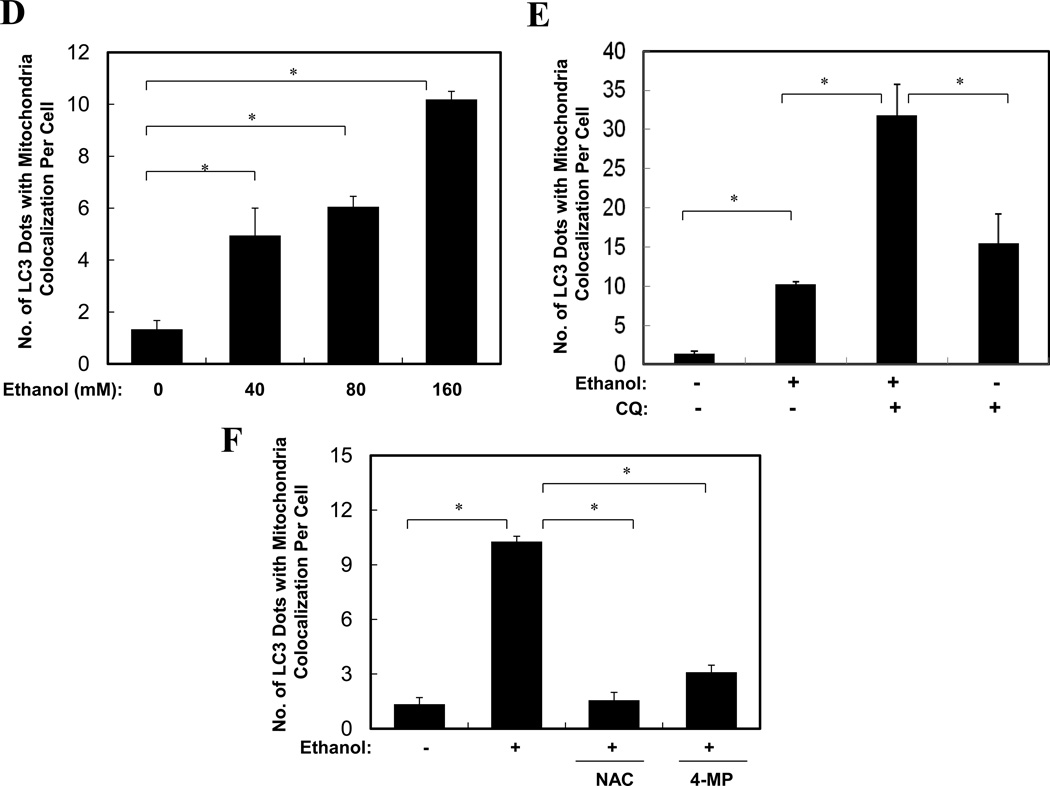
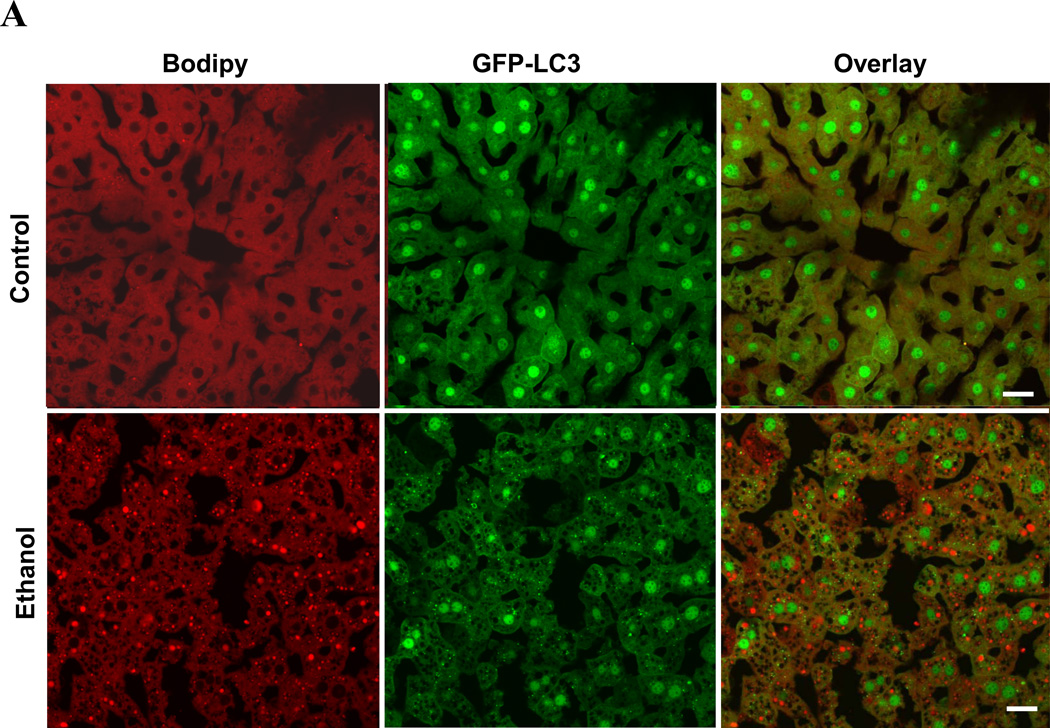
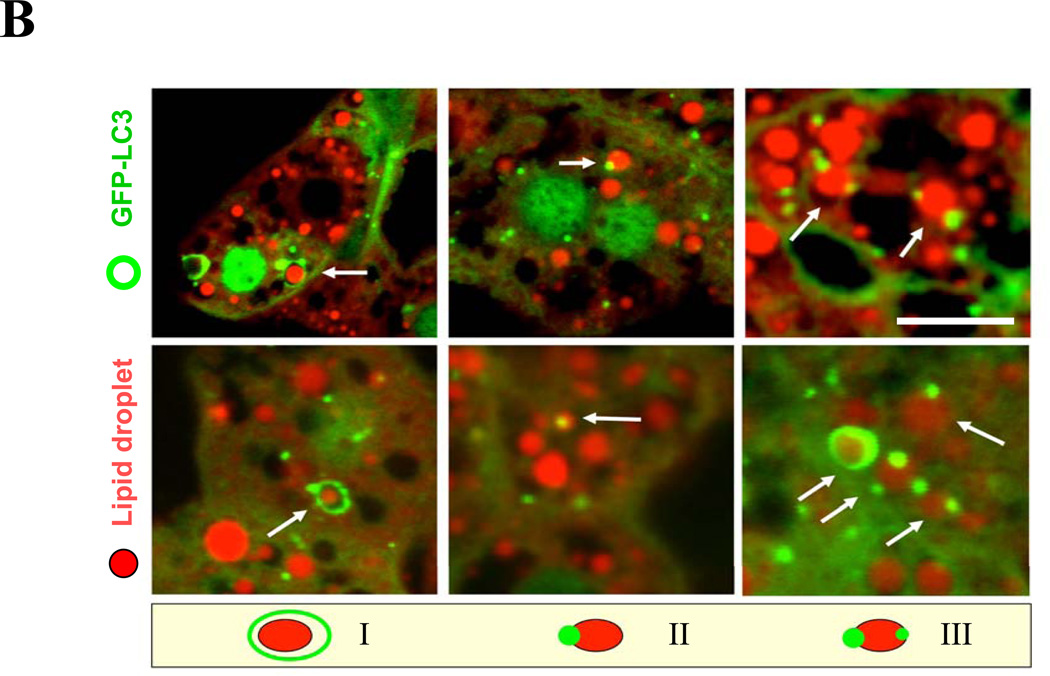
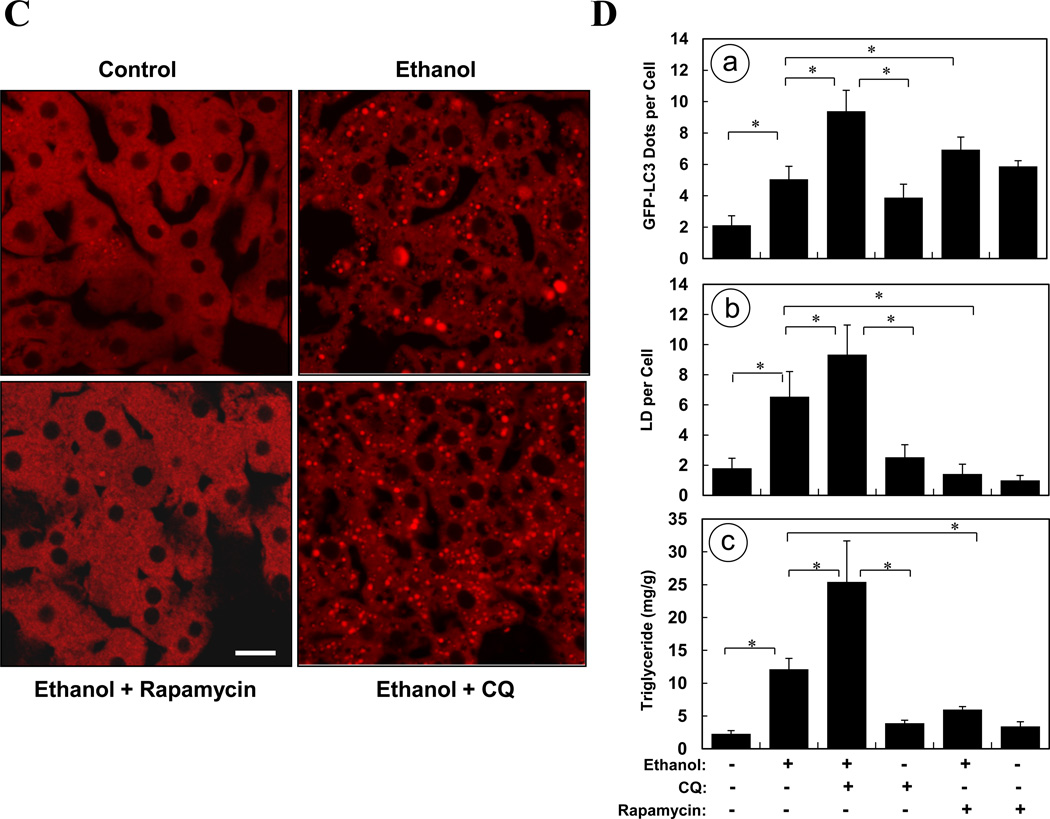
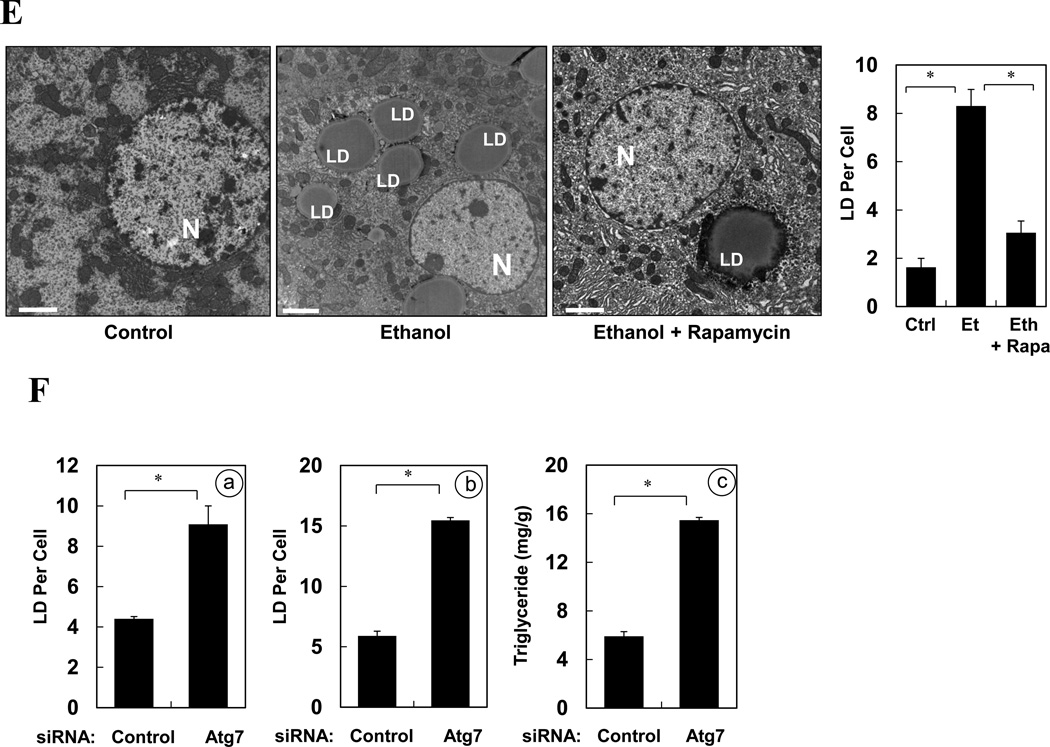
Results: Ethanol-induced macroautophagy in the livers of mice and cultured cells required ethanol metabolism, generation of reactive oxygen species, and inhibition of mammalian target of rapamycin signaling. Suppression of macroautophagy with pharmacologic agents or small interfering RNAs significantly increased hepatocyte apoptosis and liver injury; macroautophagy therefore protected cells from the toxic effects of ethanol. Macroautophagy induced by ethanol seemed to be selective for damaged mitochondria and accumulated lipid droplets, but not long-lived proteins, which could account for its protective effects. Increasing macroautophagy pharmacologically reduced hepatotoxicity and steatosis associated with acute ethanol exposure.

Conclusions: Macroautophagy protects against ethanol-induced toxicity in livers of mice. Reagents that modify macroautophagy might be developed as therapeutics for patients with alcoholic liver disease.


Figures

Figure 1
Figure 1. Acute ethanol exposure induces autophagy in the liver
(A–C). GFP-LC3 transgenic mice (n=3–5) were treated as indicated and the liver sections were analyzed by confocal microscopy (A). The number of GFP-LC3 dots (mean+SEM) were quantified from each animal (B). The total lysates (TL) and the heavy membrane fraction (HM) of the liver were analyzed by immunoblot assay (C). (D) Wild type mice were treated as indicated (n=3) and the liver fractions were analyzed by immunoblot assay. Densitometry analysis of the LC3-II and p62 was performed for each sample (mean+SEM). (E). Wild type liver samples were processed for EM. Arrows denote autophagosomes. N: nucleus, LD: lipid droplet. (F). The number of autophagosomes per given area (mean+SEM) was determined (n=3–4). Scale bar: 20 µm (A), 2 µm (E). *: p<0.05.
Figure 2
Figure 2. Ethanol induces autophagy in hepatocytes in vitro
(A–C). Ad-GFP-LC3 infected hepatocytes were treated as indicated (80 mM of ethanol in A) for 6 hours and examined by confocal microscopy (A) or immunoblot assay (C). Scale bar: 20 µm. GFP-LC3 dots (mean+SEM) were quantified for each experiment (n=3). (D–E). Ad-GFP-LC3 infected hepatocytes were treated with ethanol (80 mM, D, 40 mM, E–F) with or without 3-MA (D) or CQ (E, F) for 6 hours. GFP-LC3 dots (mean+SEM) were quantified for each experiment (n=3). Total lysates were subjected to immunoblot assay and densitometry analysis (mean+SEM) of the LC3-II was performed (n=3). (F). Hepatocytes were cultured in William’s medium/10% serum or in EBSS without or with ethanol for 15 hr and long-lived protein degradation was determined (mean+SEM, n=2–3). *: p<0.001.
Figure 3
Figure 3. Ethanol-induced autophagy requires ethanol metabolism, ROS and mTOR inhibition
(A). Ad-GFP-LC3-infected hepatocytes were treated with ethanol (80 mM) with or without 4-MP, MnTBAP or NAC for 6 hours. GFP-LC3 dots (mean+SEM) were quantified from each experiment (n=3). (B–D). Ad-GFP-LC3 infected HepG2 (B, D) and VL-17A (B, C, D) cells were treated with ethanol (40 mM unless indicated) and other agents for 24 hours. GFP-LC3 dots per cell (mean+SEM) were quantified from each experiment (B, C, n=3) and immunoblot analysis conducted (D). (E–F). Primary hepatocytes were treated as indicated for 6 hours and total lysate were subjected to immunoblot analysis. Scale bar: 10 µm (A–B). *: p<0.05.
Figure 4
Figure 4. Inhibition of autophagy promotes apoptosis in ethanol-treated primary hepatocytes and VL-17 cells
(A–B). Primary hepatocytes were treated as indicated (ethanol at 80 mM in A) and stained with Hoechst 33342. Cells with fragmented or condensed nuclei (arrows in A) (mean+SEM) were quantified for each experiment (n=2). Scale bar: 10 µm. (C). VL-17A cells were treated as indicated for 24 hours. Apoptosis (mean+SEM) was determined as in (A)(n=2). (D–F). VL-17A cells were treated as indicated (ethanol at 80 mM) for 24 hours. Beclin 1 expression was analyzed by immunoblot assay (D). Apoptosis level (E) and caspase activity (F) was determined (mean+SEM, n=2). *: p<0.05.
Figure 5
Figure 5. Inhibition of autophagy enhances ethanol-induced liver injury
(A–B). Wild type mice (n=4–6) were treated as indicated and analyzed for blood ALT level (A) and hepatic caspase-3 activity (B)(mean+SEM). (C–F). Wild type mice were given control or Atg7-specific siRNA for 48 hours before treatment with ethanol for another 16 hours. Livers were subjected to immunoblot assay (C), EM (D) and caspase-3 activity assay (F), while blood was analyzed for ALT level (E). Data (mean+SEM) were determined from each mouse (n=3). In C, each lane represented one sample and asterisk indicates a non-specific band. *: p<0.05.
Figure 6
Figure 6. Ethanol induces mitophagy
(A). Wild type mice (n=3–4) were treated as indicated. Representative liver EM images of autophagosomes containing mitochondria were shown and data (mean+SEM) were quantified. (B). Primary hepatocytes were treated with vehicle control (a) or ethanol (b) for 6 hours and examined by EM. Panel c was enlarged from the boxed area in panel b. Arrows denote autophagosomes containing fragmented mitochondria. M: mitochondria; N: nuclei. (C–F). Ad-GFP-LC3-infected primary hepatocytes were treated as indicated for 6 hours and imaged (C). Panels C-g and C-k were enlarged from the boxed areas in Panels C-f and C-j, respectively. Arrows denote selected GFP-LC3 ring structures that contained the mitochondria, which were quantified (mean+SEM)(from each experiment (n=3) D–F). Scale bar: 0.5 µm (A), 1 µm (B), 20 µm (C). *: p<0.05. Ethanol was given at 80 mM unless indicated.
Figure 7
Figure 7. Modulating autophagy affects ethanol-induced hepatic steatosis
(A). GFP-LC3 transgenic mice were treated as indicated for 16 hours. Cyrosections of livers were stained with Bodipy 581/591-C11. (B). Enlarged images denote the three types of relationship of GFP-LC3 and Bodipy581/591-C11 signals (arrows) as illustrated in the diagram. (C–D). GFP-LC3 transgenic mice (n=3–5) were treated as indicated for 16 hours. Cryosections of livers were stained with Bodipy 581/591-C11 (C). GFP-LC3 dots per cell (a), Bodipy-positive lipid droplets per cell (b) and hepatic triglyceride level (c) (mean+SEM) were quantified (D). (E). Wild type mice (n=3) were treated as indicated. Liver samples were examined by EM and the number of LD per cell (mean+SEM) was quantified. (F). Wild type mice (n=3) were treated with a control or Atg7-specific siRNA for 48 hours and then ethanol for 16 hours. The number of LD per cell in the liver by Bodipy staining (a) or by EM (b) and the hepatic triglyceride level (c) (mean+SEM) were determined. Scale bar: 20 µm (A–C), 2 µm (E). *: p<0.05

Similar articles

Cited by

References

    1. Zakhari S, Li TK. Determinants of alcohol use and abuse: Impact of quantity and frequency patterns on liver disease. Hepatology. 2007;46:2032–2039. - PubMed
    1. Lumeng L, Crabb DW. Alcoholic liver disease. Curr Opin Gastroenterol. 2000;16:208–218. - PubMed
    1. Bailey SM, Cunningham CC. Contribution of mitochondria to oxidative stress associated with alcoholic liver disease. Free Radic Biol Med. 2002;32:11–16. - PubMed
    1. Carmiel-Haggai M, Cederbaum AI, Nieto N. Binge ethanol exposure increases liver injury in obese rats. Gastroenterology. 2003;125:1818–1833. - PubMed
    1. Lieber CS. Alcoholic fatty liver: its pathogenesis and mechanism of progression to inflammation and fibrosis. Alcohol. 2004;34:9–19. - PubMed

Publication types