. 2010 Sep;11(9):820-6.
doi: 10.1038/ni.1909. Epub 2010 Jul 25.

Widespread genomic breaks generated by activation-induced cytidine deaminase are prevented by homologous recombination

Affiliations

Widespread genomic breaks generated by activation-induced cytidine deaminase are prevented by homologous recombination

Muneer G Hasham et al. Nat Immunol. 2010 Sep.

Abstract

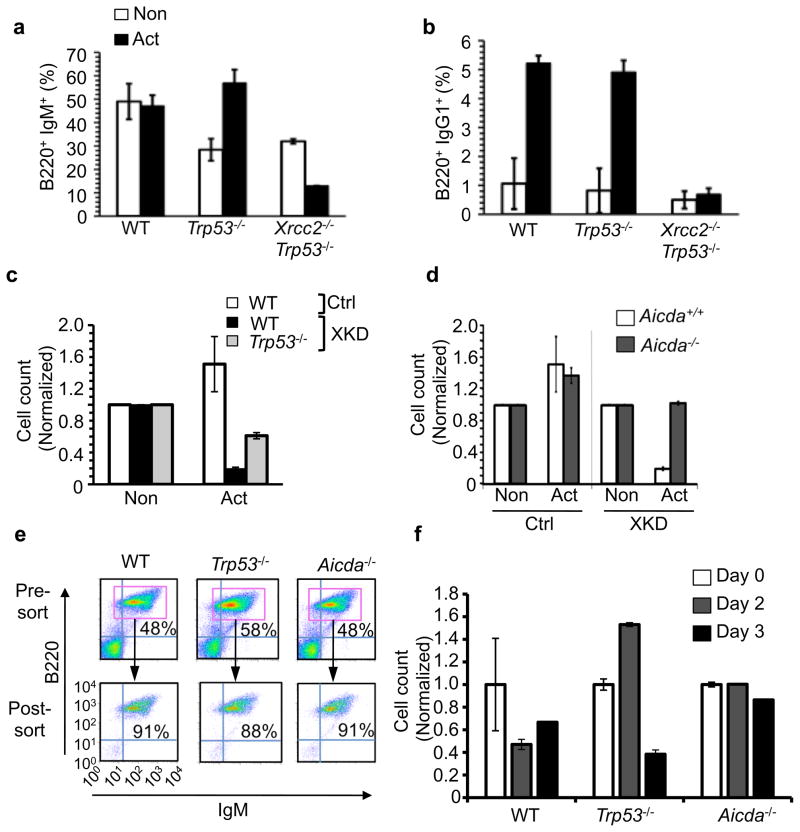
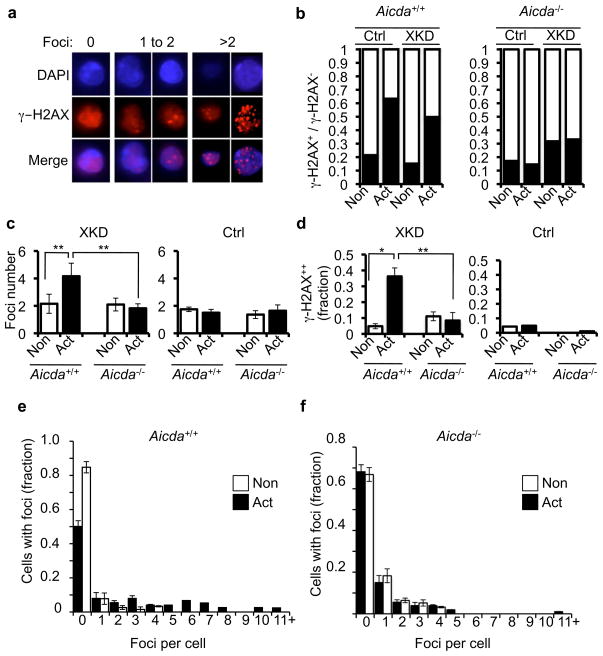
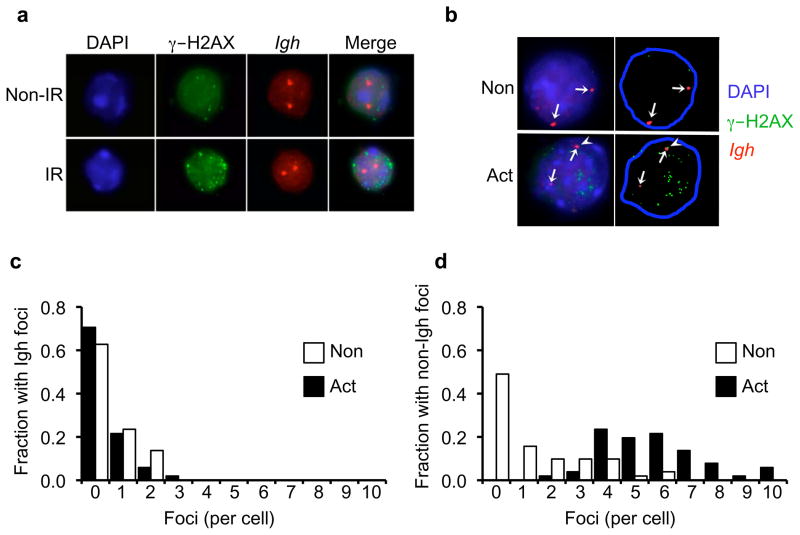
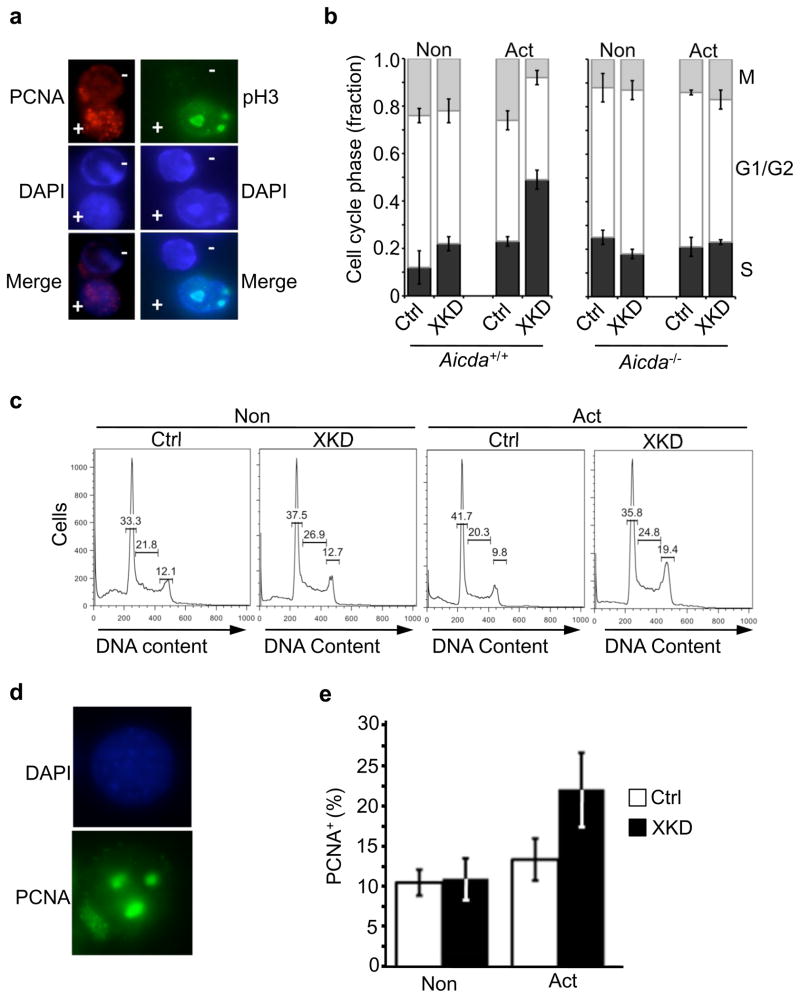
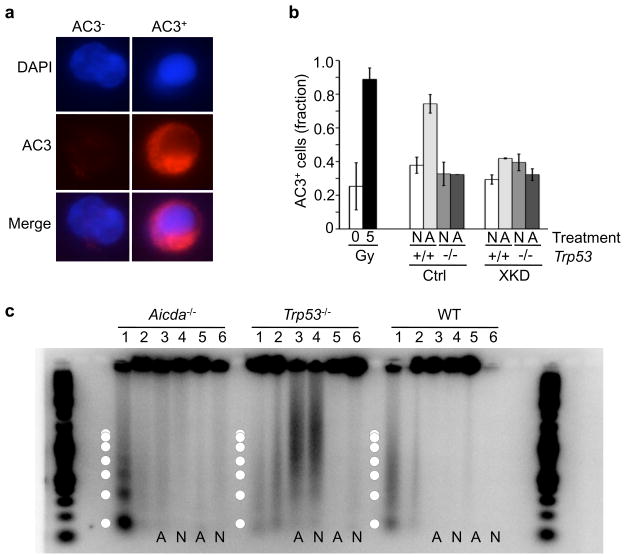
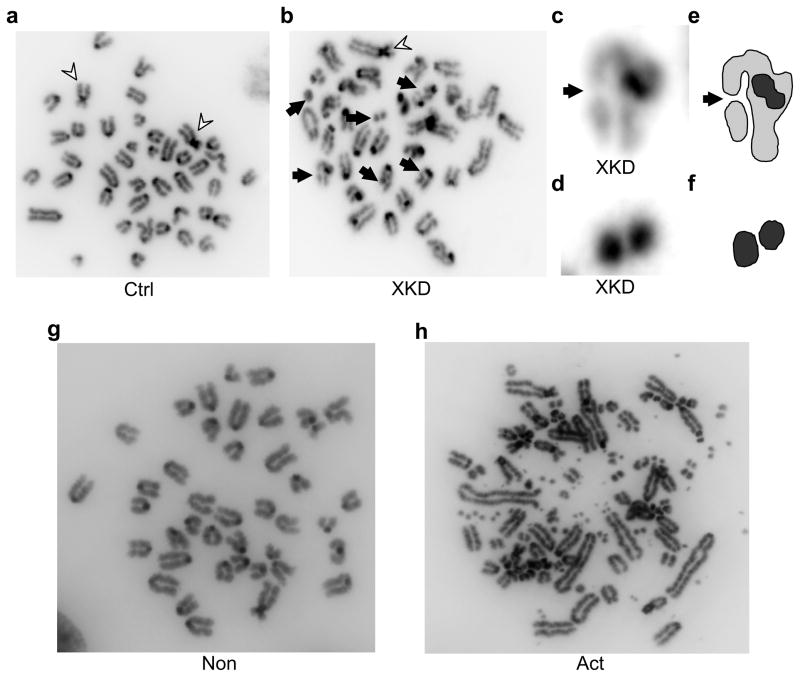
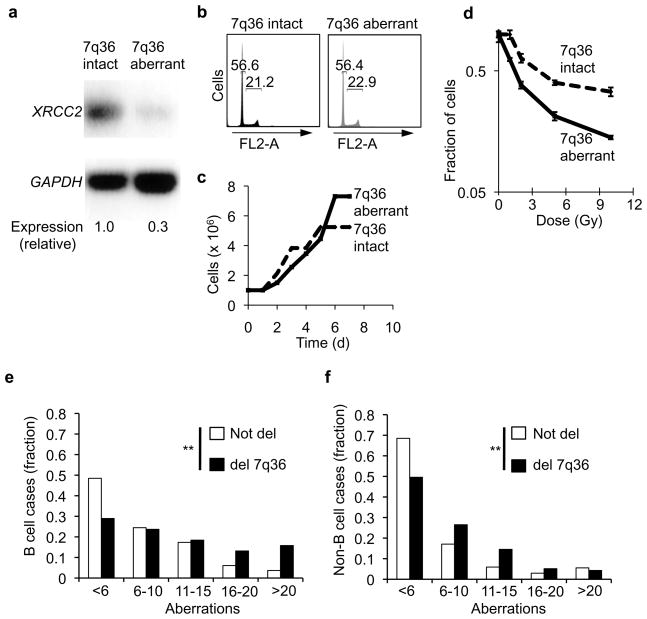
Activation-induced cytidine deaminase (AID) is required for somatic hypermutation and immunoglobulin class switching in activated B cells. Because AID has no known target-site specificity, there have been efforts to identify non-immunoglobulin AID targets. We show here that AID acts promiscuously, generating widespread DNA double-strand breaks (DSBs), genomic instability and cytotoxicity in B cells with less homologous recombination ability. We demonstrate that the homologous-recombination factor XRCC2 suppressed AID-induced off-target DSBs, promoting B cell survival. Finally, we suggest that aberrations that affect human chromosome 7q36, including XRCC2, correlate with genomic instability in B cell cancers. Our findings demonstrate that AID has promiscuous genomic DSB-inducing activity, identify homologous recombination as a safeguard against off-target AID action, and have implications for genomic instability in B cell cancers.


Figures

Figure 1
Figure 1
Activation is cytotoxic to HR-defective B cells. B cells from primary fetal liver cultures (FLCs) were stimulated for 3 days with anti-CD40 (Non) or anti-CD40 plus IL-4 (Act) and analyzed. (a) FLC-derived B cells analyzed by flow cytometry for expression of B220 and IgM. (b) B cells from (a) analyzed for B220 and IgG1 to assess class switching. (c) WT or Trp53−/− splenocytes transduced with either XKD or Ctrl-expressing shRNA constructs and stimulated after one day. Relative number of transduced cells in each culture was determined by flow cytometric measurement of EGFP positive cells 3 days post-stimulation. (d) WT or Aicda−/− cells were transduced with either XKD or Ctrl constructs and relative cell numbers with or without activation was determined as in (c). (e) Splenic B cells from WT, Trp53−/−, or Aicda−/− mice were purified by magnetic bead sorting. The purified cells (post-sort) were used as starting cultures for the experiments shown in (f). (f) Purified WT, Trp53−/− or Aicda−/− B cells were transduced with either XKD or Ctrl-expressing shRNA constructs, stimulated, and analyzed for relative cell number after activation. All data are normalized to anti-CD40 (Non) controls. For FLC assays (a–b) data represent five replicates each from WT and Trp53−/− samples and two replicates from each of two Xrcc2−/− Trp53−/− samples. For knockdown experiments data represent three (c) or four (d–f) replicates for all samples. Error bars in all plots indicate standard error.
Figure 2
Figure 2
XRCC2-defective B cells exhibit numerous AID-dependent DSBs (a) Activated primary cells expressing the XKD construct were stained for γ–H2AX. Images show cells stained with anti γ–H2AX (red), nuclei counterstained with DAPI (blue), and the merge. Examples show cells harboring 0, 1 to 2, or >2 γ–H2AX foci. (b) Aicda+/+ or Aicda−/− XKD splenic B cells were grown in non-activated (Non) or activated (Act) conditions and analyzed for γ–H2AX foci. The γ–H2AX negative fraction (no foci; open bar) versus γ–H2AX positive (one or more foci; filled bar) is shown for each sample (c) The average number of foci in γ–H2AX positive fraction of each sample from (b) was determined. (d) Fraction of cells with supernumerary γ–H2AX foci (greater than 2 foci per cell) was determined for the γ–H2AX-positive cells in (b). (e–f) Data from (b) were separated into unitary bins (0, 1, 2, 3, etc.) up to 10 foci/cell. Cells with greater numbers of foci were grouped in the >10 foci/cell bin. Plotted are the data for Non versus Act samples of either (e) WT or (f) Aicda−/− cultures. Error bars indicate standard error of the mean. Significance was determined by two sample t-test. **p<0.01 *p<0.05.
Figure 3
Figure 3
AID generates widespread off-target DSBs. (a) Fluorescence in situ hybridization (FISH) detection of Igh (red) and immunofluorescent detection of γ–H2AX (green) in B cells either non-irradiated (Non-IR) or exposed to 5 Gy (IR) ionizing radiation. Nuclei counterstained with DAPI. (b) FISH analysis of CH12/XKD cells under non-activated (Non) or activated (Act) culture conditions showing the localization of γ–H2AX foci (green) and the Igh loci (red). Arrows indicate Igh signals. Flare in the activated culture indicates a γH2AX focus co-localized with one Igh FISH signal. (c–d) γH2AX foci were counted in cells from (b) and visually scored as colocalized with the Igh locus (Igh foci; c) or not localized to the Igh locus (non-Igh foci;d). Data were separated into unitary bins up to 10 foci, and the fraction of non-activated (blue bars; N=51 nuclei) or activated (red bars; N=51 nuclei) cells showing Igh foci (c) or non-Igh foci (d) is plotted. Magnified images are shown in Supplementary Fig. 12. Detailed segmentation is shown in Supplementary Fig. 13.
Figure 4
Figure 4
Activation induces AID-dependent S-phase accumulation in XRCC2-defective B cells. (a) Immunofluorescence detection of either the S-phase marker PCNA (red) or the M-phase marker phosphorylated histone H3 (pH3; green). Shown are images with positively (+) and negatively (−) staining cells in the same field of view (top panels). DAPI DNA counterstained (blue; middle panels) and merged images (bottom panels) are also shown. (b) Quantification of PCNA and pH3 immunostaining data for Aicda+/+ or Aicda−/− B cell cultures with either the XKD or Ctrl (EGFP) constructs that were cultured with anti-CD40 plus IL-4 (Act) or anti-CD40 alone (Non). The fractions of PCNA positive cells (black bars) indicative of S-phase, pH3 positive cells (gray bars) indicative of M-phase, or the double negative cells, indicating G1 or G2 (open bars) are shown. (c) Representative flow cytometry showing cell cycle distribution. Histograms of propidium iodide (PI) staining in Ctrl or XKD cells under non-activating or activating conditions, with percentage of G1, S, and G2/M cells shown. (d–e) Fractions of cells from (c) showing punctate PCNA staining, indicating S-phase, was determined. Error bars indicate S.E.M. from three independent experiments.
Figure 5
Figure 5
AID-induced cytotoxicity in HR-defective B cells is apoptosis-independent. (a) Immunofluorescence detection of activated caspase 3 (AC3) a marker of apoptotic cells. Non-apoptotic (AC3) and an apoptotic (AC3+) splenocyte, DAPI counterstained nuclei (blue), activated caspase 3 (AC3; red). (b) Primary splenocytes from Trp53+/+ or Trp53−/− mice transduced with either XKD or Ctrl shRNA construct analyzed for AC3 by flow cytometry after culture in non-activating (N; anti-CD40-alone) or activating (A; anti-CD40 plus IL-4) conditions. As controls, freshly isolated wild-type splenocytes were analyzed after exposure to 0 or 5Gy ionizing irradiation. (c) Genomic DNA from Aicda−/−, Trp53−/−, or wild-type (WT) primary splenocytes. Each sample was either non-transduced (lanes 1,2 each), transduced with the XKD construct (lanes 3,4) or transduced with the Ctrl construct (lanes 5,6). As controls for DNA damage-induced apoptotic laddering, untransduced samples (Aicda−/−, Trp53−/−, and WT) were analyzed either after (lanes 1) or before (lanes 2) exposure to 5Gy of IR. Transduced (XKD or scrambled) samples were run after activating (A: lanes 3 and 5) or non-activating (N: lanes 4 and 6) culture. Superimposed circles designate approximate band sizes expected for apoptotic DNA laddering. AC3 data (b) represent mean of four replicates for each sample. DNA laddering assays (c) were performed on two independent mice for each genotype.
Figure 6
Figure 6
B cell activation induces chromosomal instability in HR-defective cells. CH12-F3 cells were stably transduced with either the XKD or Ctrl shRNA construct (CH12/XKD and CH12/Ctrl, respectively), and were karyotyped after exposure to 1 μg/ml anti-CD40 alone (Non) or to 1 μg/ml anti-CD40 plus 25 ng/ml IL-4 and 1ng/ml TGFβ (Act). Shown are images of (a) activated CH12/Ctrl cells or (b) activated CH12/XKD cells. Flares indicate two Robertsonian-type chromosome translocations present in the parental cell line; arrows indicate induced de novo chromosome and chromatid breaks. (c) Magnified image of a chromatid break in (b). Arrow indicates a chromatid break. (d) Magnified image of chromosome fragment from (b). (e,f) Segmentation of images from c,d respectively. (g,h) Karyotypes from non-activated (g) or activated (h) CH12/XKD cells. Example of activation-induced extreme instability is shown in (h).
Figure 7
Figure 7
Chromosome 7q36 aberrations correspond with decreased XRCC2 expression and karyotype instability in human B-lymphoid cancer cells. (a) Reverse transcription (RT)-PCR analysis of XRCC2 and GAPDH (loading control) transcripts in matched human B cell cells lines (Coriell Institute) either with intact 7q36 (GM07323) or cytogenetically aberrant 7q36 (GM13689 (b) Cell cycle profile analysis of 7q36-intact and 7q36-aberrant cell lines as determined by flow cytometry. (c) Proliferation analysis of 7q36 intact and 7q36 aberrant cells. (d) 7q36-aberrant cell line shows hypersensitivity to ionizing irradiations, an expected phenotype associated with diminished XRCC2 expression. (e,f) Karyotype data were analyzed from 46,075 case reports in the Mitelman Database of Chromosome Aberrations in Cancer (CGAP). (e) All B-cell cancer case reports (N=11,994) were analyzed for the total number of chromosome aberrations per cell. Plots show the fraction of cases within the indicated bin for tumors with 7q36 deletions or without 7q36 deletions. (f) All non-B cell cancer case reports in the Mitelman database (N=34,081) were scored for chromosome aberrations as in panel (f). Case reports with 7q36 deletions or without 7q36 deletions are plotted. Statistical significance was determined by chi-square test. ** p<0.001

Similar articles

Cited by

References

    1. Mills KD, Ferguson DO, Alt FW. The role of DNA breaks in genomic instability and tumorigenesis. Immunol Rev. 2003;194:77–95. - PubMed
    1. Muramatsu M, Nagaoka H, Shinkura R, Begum NA, Honjo T. Discovery of activation-induced cytidine deaminase, the engraver of antibody memory. Adv Immunol. 2007;94:1–36. - PubMed
    1. Durandy A, Taubenheim N, Peron S, Fischer A. Pathophysiology of B-cell intrinsic immunoglobulin class switch recombination deficiencies. Adv Immunol. 2007;94:275–306. - PubMed
    1. Chaudhuri J, et al. Evolution of the immunoglobulin heavy chain class switch recombination mechanism. Adv Immunol. 2007;94:157–214. - PubMed
    1. Liu M, et al. Two levels of protection for the B cell genome during somatic hypermutation. Nature. 2008;451:841–845. - PubMed

Publication types

LinkOut - more resources