Suppressor of cytokine signaling 3 inhibits antiviral IFN-beta signaling to enhance HIV-1 replication in macrophages
- PMID: 20631305
- PMCID: PMC3935802
- DOI: 10.4049/jimmunol.0903563
Suppressor of cytokine signaling 3 inhibits antiviral IFN-beta signaling to enhance HIV-1 replication in macrophages
Abstract
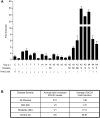
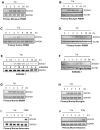
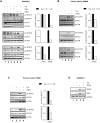
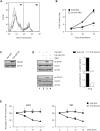
HIV-1 replication within macrophages of the CNS often results in cognitive and motor impairment, which is known as HIV-associated dementia (HAD) in its most severe form. IFN-beta suppresses viral replication within these cells during early CNS infection, but the effect is transient. HIV-1 eventually overcomes this protective innate immune response to resume replication through an unknown mechanism, initiating the progression toward HAD. In this article, we show that Suppressor of Cytokine Signaling (SOCS)3, a molecular inhibitor of IFN signaling, may allow HIV-1 to evade innate immunity within the CNS. We found that SOCS3 is elevated in an in vivo SIV/macaque model of HAD and that the pattern of expression correlates with recurrence of viral replication and onset of CNS disease. In vitro, the HIV-1 regulatory protein transactivator of transcription induces SOCS3 in human and murine macrophages in a NF-kappaB-dependent manner. SOCS3 expression attenuates the response of macrophages to IFN-beta at proximal levels of pathway activation and downstream antiviral gene expression and consequently overcomes the inhibitory effect of IFN-beta on HIV-1 replication. These studies indicate that SOCS3 expression, induced by stimuli present in the HIV-1-infected brain, such as transactivator of transcription, inhibits antiviral IFN-beta signaling to enhance HIV-1 replication in macrophages. This consequence of SOCS3 expression in vitro, supported by a correlation with increased viral load and onset of CNS disease in vivo, suggests that SOCS3 may allow HIV-1 to evade the protective innate immune response within the CNS, allowing the recurrence of viral replication and, ultimately, promoting progression toward HAD.
Figures


Similar articles
-
Innate immune responses and control of acute simian immunodeficiency virus replication in the central nervous system.J Neurovirol. 2004;10 Suppl 1:15-20. doi: 10.1080/753312747. J Neurovirol. 2004. PMID: 14982734
-
Japanese encephalitis virus infection modulates the expression of suppressors of cytokine signaling (SOCS) in macrophages: implications for the hosts' innate immune response.Cell Immunol. 2013 Sep-Oct;285(1-2):100-10. doi: 10.1016/j.cellimm.2013.09.005. Epub 2013 Oct 3. Cell Immunol. 2013. PMID: 24140964
-
CUGBP1 is required for IFNbeta-mediated induction of dominant-negative CEBPbeta and suppression of SIV replication in macrophages.J Immunol. 2007 Dec 1;179(11):7262-9. doi: 10.4049/jimmunol.179.11.7262. J Immunol. 2007. PMID: 18025168
-
Modulation of intracellular restriction factors contributes to methamphetamine-mediated enhancement of acquired immune deficiency syndrome virus infection of macrophages.Curr HIV Res. 2012 Jul;10(5):407-14. doi: 10.2174/157016212802138797. Curr HIV Res. 2012. PMID: 22591364 Free PMC article. Review.
-
An SIV/macaque model targeted to study HIV-associated neurocognitive disorders.J Neurovirol. 2018 Apr;24(2):204-212. doi: 10.1007/s13365-017-0582-4. Epub 2017 Oct 3. J Neurovirol. 2018. PMID: 28975505 Free PMC article. Review.
Cited by
-
Type I Interferons in NeuroHIV.Viral Immunol. 2019 Jan/Feb;32(1):7-14. doi: 10.1089/vim.2018.0085. Epub 2018 Sep 27. Viral Immunol. 2019. PMID: 30260742 Free PMC article. Review.
-
SOCS proteins and their roles in the development of glioblastoma.Oncol Lett. 2022 Jan;23(1):5. doi: 10.3892/ol.2021.13123. Epub 2021 Nov 5. Oncol Lett. 2022. PMID: 34820004 Free PMC article. Review.
-
Coxsackievirus B3 Infection of Human Neural Progenitor Cells Results in Distinct Expression Patterns of Innate Immune Genes.Viruses. 2020 Mar 17;12(3):325. doi: 10.3390/v12030325. Viruses. 2020. PMID: 32192194 Free PMC article.
-
Type I interferon and HIV: Subtle balance between antiviral activity, immunopathogenesis and the microbiome.Cytokine Growth Factor Rev. 2018 Apr;40:19-31. doi: 10.1016/j.cytogfr.2018.03.003. Epub 2018 Mar 16. Cytokine Growth Factor Rev. 2018. PMID: 29576284 Free PMC article. Review.
-
Distinct Patterns of Tryptophan Maintenance in Tissues during Kynurenine Pathway Activation in Simian Immunodeficiency Virus-Infected Macaques.Front Immunol. 2016 Dec 19;7:605. doi: 10.3389/fimmu.2016.00605. eCollection 2016. Front Immunol. 2016. PMID: 28066416 Free PMC article.
References
-
- Ellis R, Langford D, Masliah E. HIV and antiretroviral therapy in the brain: neuronal injury and repair. Nat Rev Neurosci. 2007;8:33–44. - PubMed
-
- Kaplan RM, Anderson JP, Patterson TL, McCutchan JA, Weinrich JD, Heaton RK, Atkinson JH, Thal L, Chandler J, Grant I. Validity of the Quality of Well-Being Scale for persons with human immunodeficiency virus infection. HNRC Group. HIV Neurobehavioral Research Center. Psychosom Med. 1995;57:138–147. - PubMed
-
- Heaton RK, Velin RA, McCutchan JA, Gulevich SJ, Atkinson JH, Wallace MR, Godfrey HP, Kirson DA, Grant I. Neuropsychological impairment in human immunodeficiency virus-infection: implications for employment. HNRC Group. HIV Neurobehavioral Research Center. Psychosom Med. 1994;56:8–17. - PubMed
-
- Mayeux R, Stern Y, Tang MX, Todak G, Marder K, Sano M, Richards M, Stein Z, Ehrhardt AA, Gorman JM. Mortality risks in gay men with human immunodeficiency virus infection and cognitive impairment. Neurology. 1993;43:176–182. - PubMed
Publication types
MeSH terms
Substances
Grants and funding
- R01 NS045290/NS/NINDS NIH HHS/United States
- NS45290/NS/NINDS NIH HHS/United States
- NS050028/NS/NINDS NIH HHS/United States
- R01 NS050665/NS/NINDS NIH HHS/United States
- NS50665/NS/NINDS NIH HHS/United States
- NS47984/NS/NINDS NIH HHS/United States
- NS055648/NS/NINDS NIH HHS/United States
- F30-NS-65600/NS/NINDS NIH HHS/United States
- R01 NS036765/NS/NINDS NIH HHS/United States
- R01 NS055648/NS/NINDS NIH HHS/United States
- MH70306/MH/NIMH NIH HHS/United States
- AI064012/AI/NIAID NIH HHS/United States
- F30 NS065600/NS/NINDS NIH HHS/United States
- NS57563/NS/NINDS NIH HHS/United States
- P01 MH070306/MH/NIMH NIH HHS/United States
- R01 NS057563/NS/NINDS NIH HHS/United States
- R01 NS047984/NS/NINDS NIH HHS/United States
- T32 AI007493/AI/NIAID NIH HHS/United States
- R56 AI077457/AI/NIAID NIH HHS/United States
- AI077457/AI/NIAID NIH HHS/United States
- R01 AI064012/AI/NIAID NIH HHS/United States
- R01 NS050028/NS/NINDS NIH HHS/United States
- R01 AI077457/AI/NIAID NIH HHS/United States
- T32-AI-07493/AI/NIAID NIH HHS/United States
LinkOut - more resources
Full Text Sources
Other Literature Sources
Molecular Biology Databases

