. 2010 Aug 2;207(8):1757-73.
doi: 10.1084/jem.20100086. Epub 2010 Jul 12.

Myeloid cells, BAFF, and IFN-gamma establish an inflammatory loop that exacerbates autoimmunity in Lyn-deficient mice

Affiliations

Myeloid cells, BAFF, and IFN-gamma establish an inflammatory loop that exacerbates autoimmunity in Lyn-deficient mice

Patrizia Scapini et al. J Exp Med. .

Abstract

Autoimmunity is traditionally attributed to altered lymphoid cell selection and/or tolerance, whereas the contribution of innate immune cells is less well understood. Autoimmunity is also associated with increased levels of B cell-activating factor of the TNF family (BAFF; also known as B lymphocyte stimulator), a cytokine that promotes survival of self-reactive B cell clones. We describe an important role for myeloid cells in autoimmune disease progression. Using Lyn-deficient mice, we show that overproduction of BAFF by hyperactive myeloid cells contributes to inflammation and autoimmunity in part by acting directly on T cells to induce the release of IFN-gamma. Genetic deletion of IFN-gamma or reduction of BAFF activity, achieved by either reducing myeloid cell hyperproduction or by treating with an anti-BAFF monoclonal antibody, reduced disease development in lyn(-/-) mice. The increased production of IFN-gamma in lyn(-/-) mice feeds back on the myeloid cells to further stimulate BAFF release. Expression of BAFF receptor on T cells was required for their full activation and IFN-gamma release. Overall, our data suggest that the reciprocal production of BAFF and IFN-gamma establishes an inflammatory loop between myeloid cells and T cells that exacerbates autoimmunity in this model. Our findings uncover an important pathological role of BAFF in autoimmune disorders.


Figures
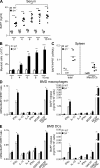
Figure 1.
Figure 1.
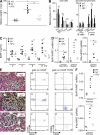
Increased BAFF production by lyn−/− myeloid cells in vivo and in vitro. (A) ELISA of BAFF serum levels in WT and lyn−/− mice. Statistical differences in BAFF serum levels between WT and lyn−/− mice are indicated at each time point. Statistical differences in serum BAFF between 2- and 10-mo-old lyn−/− mice are also reported. Each symbol represents the BAFF serum level of an individual mouse. Horizontal bars represent means. Data are representative of two independent kinetic experiments. (B) Single-cell suspensions of spleens from WT or lyn−/− mice at different ages were prepared, counted, and stained for FACS analysis. The total number of Mac-1+ myeloid cells is reported. Data are expressed as means ± SEM (n = 6–10 mice per time point). Data are pooled from two separate kinetic experiments. (C) BAFF mRNA expression in total spleen or sorted splenic macrophages and DCs (F4/80+CD11c+) from 6–8-mo-old WT or lyn−/− mice. Horizontal bars represent means. Data are representative of one end-point experiment (n = 4–6). (D and E) BAFF mRNA expression and protein release in vitro by BMD macrophages or BMD DCs, prepared as described in Materials and methods from 2–3-mo-old WT or lyn−/− mice, were determined by quantitative RT-PCR and ELISA, respectively. BAFF mRNA expression (24 h; left) and protein release (48 h; right) by BMD macrophages (D) or BMD DCs (E) in response to the indicated stimuli. Means ± SEM of data from four to six independent experiments are reported. *, P < 0.05; **, P < 0.01; ***, P < 0.001.
Figure 2.
Figure 2.
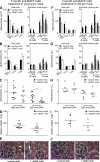
Progressive increase in T cell activation and IFN-γ production in aging lyn−/− mice. (A) IFN-γ serum levels in WT and lyn−/− mice were assessed by ELISA. Each symbol represents the IFN-γ serum level of an individual mouse. Horizontal bars represent means. Data are pooled from three independent kinetic experiments (n = 6–10). (B) IFN-γ mRNA expression in total spleens from of 6–8-mo-old WT or lyn−/− mice. Horizontal bars represent means. Data are representative of one end-point experiment (n = 3–4). (C and D) Single-cell suspensions of spleens from WT or lyn−/− mice at different ages were prepared, counted, and stained for FACS analysis. (C) Total number of TCRβ+CD44highCD62L (effector cells; left) and TCRβ+IFN-γ+ (IFN-γ–producing cells; right) are reported as evidence of T cell activation. The number and percentage of IFN-γ–producing T cells were evaluated by intracellular staining after ex vivo stimulation of splenocytes with PMA plus ionomycin for 4 h. Data are expressed as means ± SEM (n = 6–10 mice per time point). Data are pooled from two independent kinetic experiments. *, P < 0.05; **, P < 0.01. (D) Representative FACS plots demonstrating T cell activation in 10-mo-old lyn−/− mice by analysis of the expression of CD69, CD44, CD62L, and IFN-γ are reported. Data are representative of >40 mice for each genotype analyzed at end-point experiments.
Figure 3.
Figure 3.
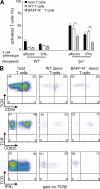
Hck and Fgr deficiency reduces BAFF serum levels, blocks splenomegaly, and improves nephritis in lyn−/− mice. (A) Each symbol represents the weight of an individual spleen from 8–10-mo-old WT, lyn−/−, or HFL−/− animals. Horizontal bars represent means. Data are pooled from two independent end-point experiments (n = 6–8). (B) Single-cell suspensions of spleens from 8–10-mo-old WT, lyn−/−, or HFL−/− mice were counted and stained for FACS analysis. (left) The absolute number of total, myeloid plus DC (Mac1+CD11c+), B (CD19+), and T (TCRβ+) cells. (right) The absolute number of activated lymphocytes, CD19+CD69+ and CD19/B220int/nullCD138+, are reported as evidence of B cell activation, whereas TCRβ+CD69+, TCRβ+CD44highCD62L (effector cells), and TCRβ+IFN-γ+ (IFN-γ–producing cells, evaluated as described in Fig. 2) cells are reported as evidence of T cell activation. Data are expressed as means ± SEM (n = 8 mice per group). Statistical differences of HFL−/− versus lyn−/− mice or HFL−/− versus WT mice are reported. Data are pooled from two independent end-point experiments. (C) BAFF serum levels in WT, lyn−/−, or HFL−/− mice assessed by ELISA. Horizontal bars represent means. Data are pooled from two independent kinetic experiments (n = 5–8). (D) BAFF (left) and IFN-γ (right) mRNA expression in sorted splenic macrophages and DCs (F4/80+CD11c+) or total spleens from 6–8-mo-old WT, lyn−/−, or HFL−/− mice. Horizontal bars represent means. Data are representative of one end-point experiment (n = 4–6). (E, left) Representative H&E staining of kidney sections from 8–10-mo-old WT, lyn−/−, or HFL−/− mice. Bars, 100 µm. (middle and right) Representative FACS plot analysis of CD45+ myeloid cells (Mac-1+; middle) and activated/effector T cells (CD44highCD62L) infiltrating the kidneys of 8–10-mo-old WT, lyn−/−, or HFL−/− mice are reported (right). Data are representative of 10–12 mice for each genotype analyzed at end-point experiments. (F) BAFF (top) and IFN-γ (bottom) mRNA expression in total kidneys from 8–10-mo-old WT, lyn−/−, or HFL−/− mice. Data are representative of one independent end-point experiment (n = 3–4). *, P < 0.05; **, P < 0.01; ***, P < 0.001.
Figure 4.
Figure 4.
Myeloid-specific Lyn deficiency induces elevated BAFF serum levels and autoimmunity. WT, rag−/−-WT, and lyn−/−rag−/−-WT chimeras were generated as described in Materials and methods. (A) BAFF serum levels in WT, rag−/−-WT, and lyn−/−rag−/−-WT chimeras, assessed by ELISA. Each symbol represents the BAFF serum level of an individual mouse. Horizontal bars represent means. Data are pooled from three independent kinetic experiments. (B) Each symbol represents the weight of an individual spleen from 10-mo-old WT, rag−/−-WT, and lyn−/−rag−/−-WT chimeras. Horizontal bars represent means. Data are pooled from three independent end-point experiments (n = 6–14). (C) Single-cell suspensions of spleens from 8–10-mo-old WT, rag−/−-WT, and lyn−/−rag−/−-WT chimeras were counted and stained for FACS analysis. (left) The absolute number of total cells and (right) the absolute number of activated lymphocytes, calculated as described for Fig. 3. Data are expressed as means ± SEM (n = 10 mice per group). Statistical differences of lyn−/−rag−/−-WT versus rag−/−-WT chimeras or rag−/−-WT versus WT chimeras are reported. Data are pooled from three independent end-point experiments. (D) A single-cell suspension of spleens was prepared and the frequencies of IgM-secreting AFCs specific to DNA were assessed by ELISPOT in 8–10-mo-old WT, rag−/−-WT, or lyn−/−rag−/−-WT chimeras or lyn−/− mice. Statistical differences of lyn−/−rag−/−-WT versus rag−/−-WT chimeras are reported. Horizontal bars represent means. Data are representative of five independent experiments. *, P < 0.05; **, P < 0.01; ***, P < 0.001. (E) Representative H&E staining of kidneys from 8–10-mo-old WT, rag−/−-WT, and lyn−/−rag−/−-WT chimeras. Bars, 100 µm. Data are representative of >20 mice for each genotype analyzed at end-point experiments.
Figure 5.
Figure 5.
IFN-γ deficiency reduces BAFF serum levels, blocks splenomegaly, and improves autoimmunity in lyn−/− mice. (A) BAFF serum levels in WT, lyn−/−, and lyn−/−IFNγ−/− mice, assessed by ELISA. Each symbol represents the BAFF serum level of an individual mouse. Data are pooled from two independent kinetic experiments (n = 5–8). (B) BAFF mRNA expression in sorted splenic macrophages and DCs (F4/80+CD11c+) and total spleens (left) or total kidneys (right) from 6–10-mo-old WT, lyn−/−, or lyn−/−IFNγ−/− mice. Data are representative of one end-point experiment (n = 4). (C) Each symbol represents the weight of an individual spleen from 8–10-mo-old WT, lyn−/−, or lyn−/−IFNγ−/− mice. Data are pooled from two independent end-point experiments (n = 8–9). Horizontal bars in A–C represent means. (D) Single-cell suspensions of spleens from 8–10-mo-old WT, lyn−/−, or lyn−/−IFNγ−/− mice were counted and stained for FACS analysis. (left) The absolute number of total cells and (right) the absolute number of activated lymphocytes, calculated as described for Fig. 3. Data are expressed as means ± SEM (n = 9 mice per group). Statistical differences of lyn−/−IFNγ−/− versus lyn−/− mice or lyn−/−IFNγ−/− versus WT mice are reported. Data are pooled from two independent end-point experiments. *, P < 0.05; **, P < 0.01; ***, P < 0.001. (E) Representative H&E staining of kidney sections from 8–10-mo-old WT, lyn−/−, or lyn−/−IFNγ−/− mice. Bars, 100 µm. Data are representative of 10–15 mice for each genotype analyzed at end-point experiments.
Figure 6.
Figure 6.
Reduction of BAFF activity ameliorates autoimmune abnormalities in lyn−/− mice. (A–J) Young (2-mo-old) lyn−/− mice were treated for 5 mo (long-term treatment; A–E) or old (6–7-mo-old) lyn−/− mice were treated for 2 mo (short-term treatment; F–J) with neutralizing anti-BAFF mAb or irrelevant isotype control mAb, as described in Materials and methods. (A, B, F, and G) Single-cell suspensions of spleens from lyn−/− mice after 5 mo (A and B) or 2 mo (F and G) of treatment with anti-BAFF mAb were counted and stained for FACS analysis. (left) The absolute number (A and F) and percentage (B and G) of total cells and (right) the absolute number (A and F) and percentage (B and G) of activated lymphocytes, calculated as described for Fig. 3. Data are expressed as means ± SEM (n = 10–11 mice per group in A and B or 5–6 mice per group in F and G). Date are representative of two independent end-point experiments. (C and H) Effect of 5 mo (C) or 2 mo (H) of anti-BAFF mAb treatment on the levels of IgM and IgG specific to DNA in lyn−/− mice, assessed by ELISA. Data are representative of two independent end-point experiments (n = 10–12). (D and I) Effect of 5 mo (D) or 2 mo (I) of anti-BAFF mAb treatment on the development of splenomegaly in lyn−/− mice. Data are representative of two independent end-point experiments (n = 10–12). *, P < 0.05; **, P < 0.01; ***, P < 0.001. Horizontal bars in C, D, H, and I represent means. (E and J) Representative H&E staining of kidneys from lyn−/− mice after 5 mo (E) or 2 mo (J) of treatment with anti-BAFF mAb. Bars, 100 µm. Data are representative of 12–16 mice for each treatment analyzed at end-point experiments.
Figure 7.
Figure 7.
BAFF-R−/− T cells fail to become activated when transferred to lyn−/− recipients. (A) Resting T cells isolated from single-cell suspensions of WT (CD45.1/2 het) or BAFF-R−/− (CD45.2) mouse spleens and lymph nodes were mixed in a 1:1 ratio and injected i.v. into 6–7-mo-old WT or lyn−/− mice (CD45.1). 15 d after transfer, the levels of T cell activation and IFN-γ production in host and donor T cells were analyzed by taking advantage of the differential expression of the CD45.1/2 markers by flow cytometry, as described in Materials and methods. The percentage of activated/effector (CD44highCD62L) or IFN-γ–producing host and donor (WT or BAFF-R−/−) T cells detected in the spleens of host WT or lyn−/− mice 15 d after adoptive transfer are reported. Data are expressed as means ± SEM (n = 7 mice per group). Data are pooled from two independent experiments. *, P < 0.05; **, P < 0.01. (B) Representative FACS plots of CD44 (top), CD62L (middle), or IFN-γ (bottom) expression by host (left) and donor WT (middle) or BAFF-R−/− (right) T (TCRβ+) cells detected in the spleens of host lyn−/− mice 15 d after adoptive transfer are reported. Data are representative of seven mice for each condition.
Figure 8.
Figure 8.
Proposed model to explain the role of BAFF, IFN-γ, and myeloid cells in Lyn-deficient autoimmunity. (A) Under normal conditions BAFF is produced in a fixed amount from stromal cells, thus regulating the size and the maturation status of the B cell compartment. (B) During B cell lymphopenia, BAFF serum levels rise, and the amount of BAFF available per B cell increases. In the Lyn-deficient model, the elevated serum BAFF caused by the B lymphopenia as well as the intrinsic hyperactivity of lyn−/− B cells contribute to increased B cell responses, leading to autoantibody production. This initial inflammatory insult is probably sufficient to partially activate T cells (which at this point can begin to express BAFF-R) and lyn−/− myeloid cells. (C) In more severe inflammatory conditions and/or during myeloid cell activation/proliferation, BAFF production dramatically increases, directly affecting both B cell and T cell activation, leading to differentiation of the latter cells into IFN-γ–producing T cells. IFN-γ, in a positive feedback loop, sustains more myeloid cell activation/proliferation and BAFF production, which in turn further amplifies the lymphocyte activation leading to autoimmunity and organ damage.

Similar articles

Cited by

References

    1. Bagavant H., Fu S.M. 2005. New insights from murine lupus: disassociation of autoimmunity and end organ damage and the role of T cells. Curr. Opin. Rheumatol. 17:523–528 10.1097/01.bor.0000169361.23325.1e - DOI - PubMed
    1. Balomenos D., Rumold R., Theofilopoulos A.N. 1998. Interferon-gamma is required for lupus-like disease and lymphoaccumulation in MRL-lpr mice. J. Clin. Invest. 101:364–371 10.1172/JCI750 - DOI - PMC - PubMed
    1. Berton G., Mócsai A., Lowell C.A. 2005. Src and Syk kinases: key regulators of phagocytic cell activation. Trends Immunol. 26:208–214 10.1016/j.it.2005.02.002 - DOI - PubMed
    1. Cash H., Relle M., Menke J., Brochhausen C., Jones S.A., Topley N., Galle P.R., Schwarting A. 2010. Interleukin 6 (IL-6) deficiency delays lupus nephritis in MRL-Faslpr mice: the IL-6 pathway as a new therapeutic target in treatment of autoimmune kidney disease in systemic lupus erythematosus. J. Rheumatol. 37:60–70 10.3899/jrheum.090194 - DOI - PubMed
    1. Chan V.W., Meng F., Soriano P., DeFranco A.L., Lowell C.A. 1997. Characterization of the B lymphocyte populations in Lyn-deficient mice and the role of Lyn in signal initiation and down-regulation. Immunity. 7:69–81 10.1016/S1074-7613(00)80511-7 - DOI - PubMed

Publication types

MeSH terms