

Genome-wide association study identifies variants in the MHC class I, IL10, and IL23R-IL12RB2 regions associated with Behçet's disease
- PMID: 20622878
- PMCID: PMC2923807
- DOI: 10.1038/ng.625
Genome-wide association study identifies variants in the MHC class I, IL10, and IL23R-IL12RB2 regions associated with Behçet's disease
Abstract
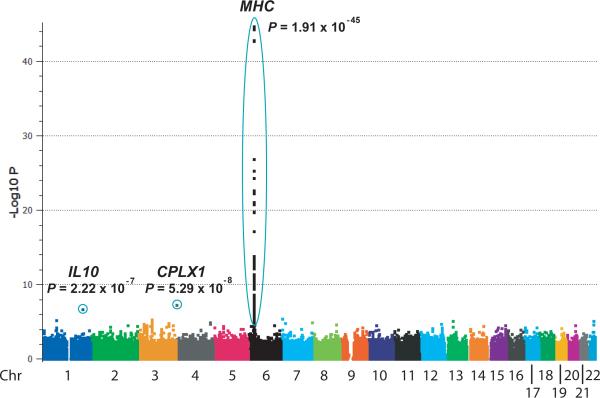
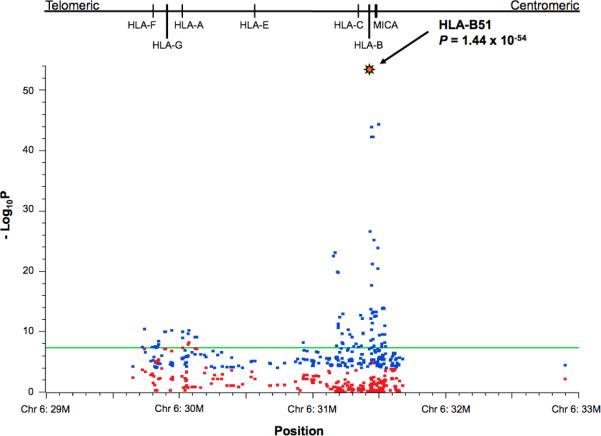
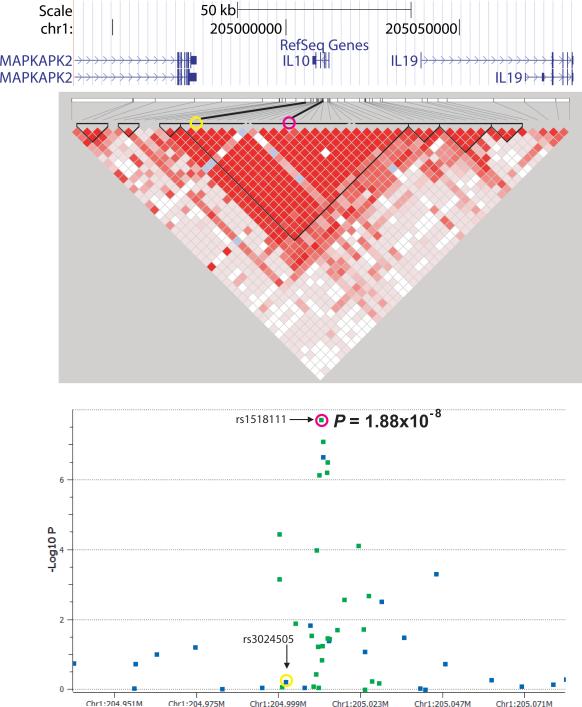
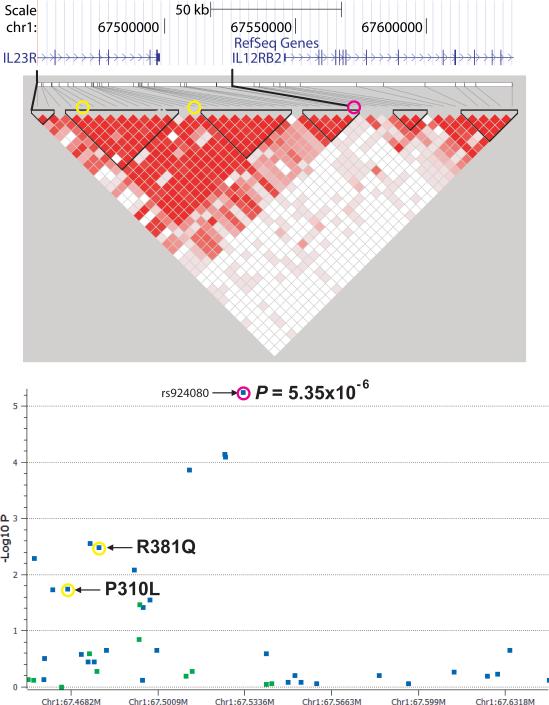
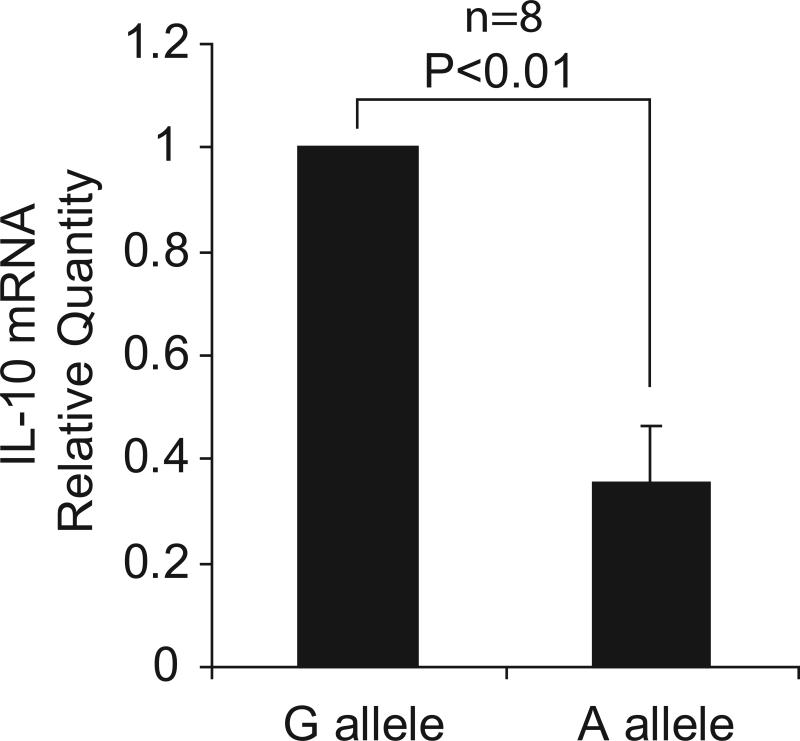
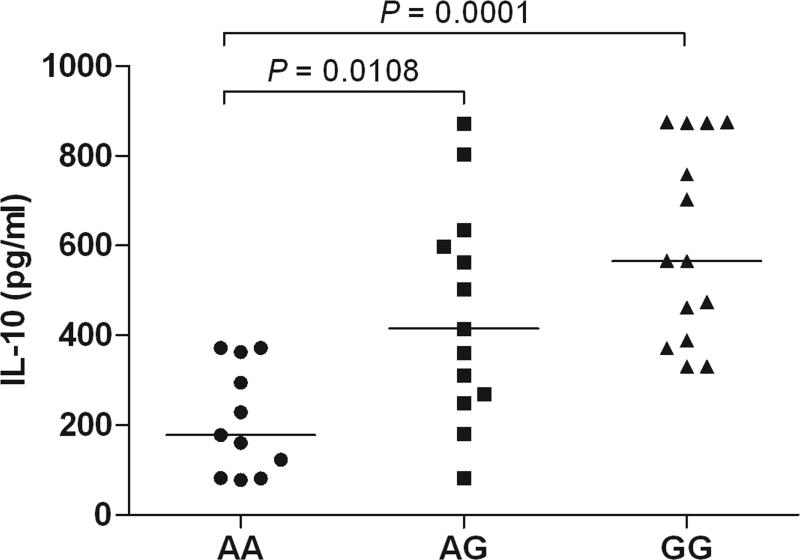
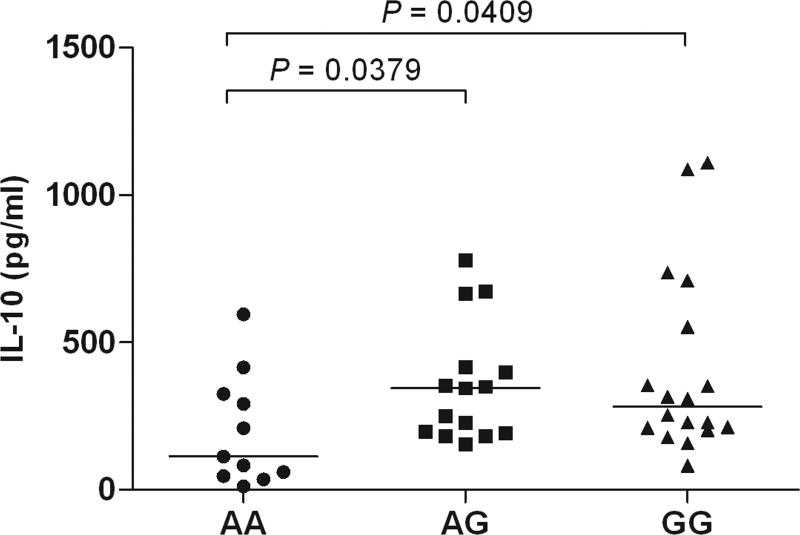
Behçet's disease is a genetically complex disease of unknown etiology characterized by recurrent inflammatory attacks affecting the orogenital mucosa, eyes and skin. We performed a genome-wide association study with 311,459 SNPs in 1,215 individuals with Behçet's disease (cases) and 1,278 healthy controls from Turkey. We confirmed the known association of Behçet's disease with HLA-B*51 and identified a second, independent association within the MHC Class I region. We also identified an association at IL10 (rs1518111, P = 1.88 x 10(-8)). Using a meta-analysis with an additional five cohorts from Turkey, the Middle East, Europe and Asia, comprising a total of 2,430 cases and 2,660 controls, we identified associations at IL10 (rs1518111, P = 3.54 x 10(-18), odds ratio = 1.45, 95% CI 1.34-1.58) and the IL23R-IL12RB2 locus (rs924080, P = 6.69 x 10(-9), OR = 1.28, 95% CI 1.18-1.39). The disease-associated IL10 variant (the rs1518111 A allele) was associated with diminished mRNA expression and low protein production.
Figures
Comment in
-
Genome-wide association studies identify IL23R-IL12RB2 and IL10 as Behçet's disease susceptibility loci.Nat Genet. 2010 Aug;42(8):703-6. doi: 10.1038/ng.624. Epub 2010 Jul 11. Nat Genet. 2010. PMID: 20622879
Similar articles
-
Association study of IL10 and IL23R-IL12RB2 in Iranian patients with Behçet's disease.Arthritis Rheum. 2012 Aug;64(8):2761-72. doi: 10.1002/art.34437. Arthritis Rheum. 2012. PMID: 22378604
-
On the genetics of the Silk Route: association analysis of HLA, IL10, and IL23R-IL12RB2 regions with Behçet's disease in an Iranian population.Immunogenetics. 2015 Jun;67(5-6):289-93. doi: 10.1007/s00251-015-0841-6. Epub 2015 May 5. Immunogenetics. 2015. PMID: 25940109
-
Identification of susceptibility SNPs in IL10 and IL23R-IL12RB2 for Behçet's disease in Han Chinese.J Allergy Clin Immunol. 2017 Feb;139(2):621-627. doi: 10.1016/j.jaci.2016.05.024. Epub 2016 Jun 21. J Allergy Clin Immunol. 2017. PMID: 27464962
-
The immunogenetics of Behçet's disease: A comprehensive review.J Autoimmun. 2015 Nov;64:137-48. doi: 10.1016/j.jaut.2015.08.013. Epub 2015 Sep 5. J Autoimmun. 2015. PMID: 26347074 Free PMC article. Review.
-
Genetics of Behçet's disease: lessons learned from genomewide association studies.Curr Opin Rheumatol. 2014 Jan;26(1):56-63. doi: 10.1097/BOR.0000000000000003. Curr Opin Rheumatol. 2014. PMID: 24257369 Review.
Cited by
-
Challenges and opportunities in transitional care process in Behçet's syndrome.Front Med (Lausanne). 2024 Sep 18;11:1456063. doi: 10.3389/fmed.2024.1456063. eCollection 2024. Front Med (Lausanne). 2024. PMID: 39359917 Free PMC article.
-
Psoriasis regression analysis of MHC loci identifies shared genetic variants with vitiligo.PLoS One. 2011;6(11):e23089. doi: 10.1371/journal.pone.0023089. Epub 2011 Nov 18. PLoS One. 2011. PMID: 22125590 Free PMC article.
-
Genetic Association of HLA-A*26, -A*31, and -B*51 with Behcet's Disease in Saudi Patients.Clin Med Insights Arthritis Musculoskelet Disord. 2016 Aug 8;9:167-73. doi: 10.4137/CMAMD.S39879. eCollection 2016. Clin Med Insights Arthritis Musculoskelet Disord. 2016. PMID: 27547040 Free PMC article.
-
Genetic Epidemiology of Psoriasis.Curr Dermatol Rep. 2014 Mar;3(1):61-78. doi: 10.1007/s13671-013-0066-6. Curr Dermatol Rep. 2014. PMID: 25580373 Free PMC article.
-
Genetic variants in the JAK1 gene confer higher risk of Behcet's disease with ocular involvement in Han Chinese.Hum Genet. 2013 Sep;132(9):1049-58. doi: 10.1007/s00439-013-1312-5. Epub 2013 May 15. Hum Genet. 2013. PMID: 23674219
References
Publication types
MeSH terms
Substances
Grants and funding
- P01 CA034936-14A19004/CA/NCI NIH HHS/United States
- ZIC AR041181-01/ImNIH/Intramural NIH HHS/United States
- Z01 AR041106-13/ImNIH/Intramural NIH HHS/United States
- Z99 AR999999/ImNIH/Intramural NIH HHS/United States
- Z99 HG999999/ImNIH/Intramural NIH HHS/United States
- PC30CA016772/CA/NCI NIH HHS/United States
- Z01 AR041139-05/ImNIH/Intramural NIH HHS/United States
- R01 ES009912-04A1/ES/NIEHS NIH HHS/United States
- P01 CA034936/CA/NCI NIH HHS/United States
- AR44422/AR/NIAMS NIH HHS/United States
- R01 ES009912/ES/NIEHS NIH HHS/United States
- Z01 AR041083-19/ImNIH/Intramural NIH HHS/United States
- P01 CA034936-19A29004/CA/NCI NIH HHS/United States
LinkOut - more resources
Full Text Sources
Other Literature Sources
Medical
Research Materials
