. 2010 Aug;177(2):632-43.
doi: 10.2353/ajpath.2010.091012. Epub 2010 Jul 8.

Tubular overexpression of transforming growth factor-beta1 induces autophagy and fibrosis but not mesenchymal transition of renal epithelial cells

Affiliations

Tubular overexpression of transforming growth factor-beta1 induces autophagy and fibrosis but not mesenchymal transition of renal epithelial cells

Robert Koesters et al. Am J Pathol. 2010 Aug.

Abstract

We recently showed in a tetracycline-controlled transgenic mouse model that overexpression of transforming growth factor (TGF)-beta1 in renal tubules induces widespread peritubular fibrosis and focal degeneration of nephrons. In the present study we have analyzed the mechanisms underlying these phenomena. The initial response to tubular cell-derived TGF-beta1 consisted of a robust proliferation of peritubular cells and deposition of collagen. On sustained expression, nephrons degenerated in a focal pattern. This process started with tubular dedifferentiation and proceeded to total decomposition of tubular cells by autophagy. The final outcome was empty collapsed remnants of tubular basement membrane embedded into a dense collagenous fibrous tissue. The corresponding glomeruli survived as atubular remnants. Thus, TGF-beta1 driven autophagy may represent a novel mechanism of tubular decomposition. The fibrosis seen in between intact tubules and in areas of tubular decomposition resulted from myofibroblasts that were derived from local fibroblasts. No evidence was found for a transition of tubular cells into myofibroblasts. Neither tracing of injured tubules in electron micrographs nor genetic tagging of tubular epithelial cells revealed cells transgressing the tubular basement membrane. In conclusion, overexpression of TGF-beta1 in renal tubules in vivo induces interstitial proliferation, tubular autophagy, and fibrosis, but not epithelial-to-mesenchymal transition.


Figures

Figure 1
Figure 1
Experimental strategy. A: PT mice. We used PT (Pax8-rtTA/tet-o-TGF-β1 double transgenic) mice to direct TGF-β1 overexpression to renal epithelial cells. In these mice, rtTA is expressed under the control of the kidney-specific Pax8 promoter. rtTA binds to and transactivates the tetracycline-responsive element (TRE) but binding is dependent on the presence of doxycycline (DOX). Only when DOX is administered will TGF-β1 be expressed (Tet-on). B: PLRT mice. For fate-tracing experiments PLRT (Pax8-rtTA/LC1/Rosa26R/tet-o-TGF-β1 quadruple transgenic) mice were used. Pax8-rtTA directs the simultaneous expression of TGF-β1 and Cre recombinase. The latter enzyme removes the stop cassette at the Rosa26R locus, thereby irreversibly activating the expression of β-galactosidase from the Rosa26 promoter. Since the Rosa26 promoter is active in any cell type cells become genetically tagged.
Figure 2
Figure 2
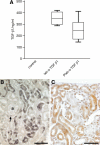
TGF-β1 expression. A: Plasma levels of TGF-β1 protein. Biologically active TGF-β1 protein in the plasma of induced mice (n = 6) was assayed by enzyme-linked immunosorbent assay. Control, Pax8-rtTA single transgenic mice induced for two days with doxycycline. Tet-o-TGF-β1, Pax8-rtTA/tet-o-TGF-β1 double transgenic mice induced for two days with doxycycline. Ptet-TGF-β1, Pax8-rtTA/Ptet-TGF-β1 double transgenic mice induced for two days with doxycycline. B and C: Tissue expression of TGF-β1 in Pax8-rtTA/tet-o-TGF-β1 double transgenic mice. B: In situ hybridization of TGF-β1 mRNA. Tubular cells are heterogeneously labeled; between no label and strong label all intermediates are found. The glomerular tuft (asterisk) is negative. The glomerular parietal epithelium in males frequently contains proximal tubule cells that are generally labeled (arrow; in this case only weakly). C: Immunostaining of TGF-β. At the protein level a heterogeneous pattern of TGF-β expression is also seen. PT mice, after three days (B), and after two days (C) of DOX stimulation. Scale bar = 50 μm.
Figure 3
Figure 3
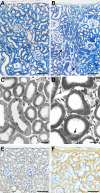
Early responses. A and B: Renal cortex, overview. Control (A); after four days of DOX (B), a massive expansion of the peritubular interstitium is seen; focally, tubules start to decompose (arrows). C and D: Cortical tubules and peritubular interstitium by TEM. Control (C); after 4 days (D) of DOX interstitial spaces and cells were dramatically increased; tubules are intact; focally, initial changes are seen (arrow). E and F: Renal cortex; immunostaining of collagen type 1 in controls (E) and after four days of stimulation (F). Note the diffuse deposition of collagen in (F); tubules maintain a normal structure. PT mice; Scale bars: 200 μm (A, B, E, F); 20 μm (C); and 10 μm (D).
Figure 4
Figure 4
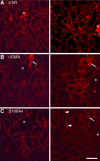
Immunocytochemistry. Immunostaining of peritubular cells for 5′NT (A), αSMA (B), and S 100A4 (C) in controls (left column) and PT mice (right column). The three pictures of each column are taken from consecutive sections, thus they show the same area; note the position of the glomerulus (asterisk). A: In addition to peritubular fibroblasts the brush border of proximal tubules and the mesangium (specifically in mice) stains with 5′NT; the interstitial 5′NT positive cells were much more abundant after TGF-β stimulation. B: αSMA-positive peritubular cells are not present in controls; only the smooth muscle cells of a glomerular arteriole are stained (arrows). After DOX treatment there is a dramatic appearance of αSMA-positive cells around affected tubules. The interstitial sites of 5′NT and αSMA positivity are congruent. C: No S100A4-positive cells are found in controls; a few cells are found after DOX treatment in interstitial position (arrowheads); they possibly represent lymphocytes. The smooth muscle cells of arterioles (arrow) are also stained. PT mice after three days of DOX. Scale bar = 20 μm.
Figure 5
Figure 5
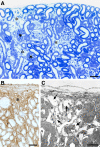
Tubular degeneration after prolonged treatment with DOX. A: Cortex, overview. Areas with tubular decomposition (asterisks) are intermingled with areas of normal tubules. A collapsed or sclerotic glomerulus (stars) is generally found adjacent to an area with tubular degeneration. B: Immunostaining of collagen I. Area of tubular decomposition (asterisk) that contains large amounts of collagen I. C: Overview of an area of tubular decomposition (TEM). The tubular remnants (arrows) consist of cylinders of TBM largely devoid of cells. PT mice: A and C after three, and B after six cycles of DOX. Scale bars: 100 μm (A) and (B); 20 μm (C).
Figure 6
Figure 6
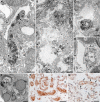
Decomposition of tubules by autophagy. A: Overview of a tubular profile at an intermediate stage of decomposition. The cells have separated from the TBM and joined to a single strand, the tubular lumen is fully lost. The cells contain large amounts of autophagic vacuoles (arrows). Note that the cell nuclei do not show apoptotic condensations (asterisks). The TBM is thickened and heavily wrinkled; gaps in the TBM are not seen. Outside the TBM collagen is accumulated (star). B–D: Late stages of tubular decomposition. B: A remnant tubular profile, bordered by a heavily wrinkled, but continuous TBM, containing the debris of several bursting cells; outside the TBM large amounts of collagen are seen (star). C: Tubular profile that contains a single cell with large autophagic vacuoles; the nucleus (asterisk) shows no signs of apoptosis. D: Empty wrinkled TBM profiles. Collagen is only encountered in the surroundings (star). E: Autophagic elements with many double membranes as are characteristic for autophagy. F: Degenerating tubular profiles are strongly stained for LC3; intact tubules (asterisk) are unstained. G: A group of degenerating tubules; the nuclei are unlabeled (arrows) in the TUNEL assay. PT mice: A to D, F and G six cycles, E three cycles of DOX. Scale bars: 10 μm (A and D), 4 μm (B and C), 1 μm (E), and 20 μm (F and G).
Figure 7
Figure 7
Outline of tubular basement membrane. To trace the exact borders of degenerating tubules low power transmission electron micrographs are frequently insufficient. In A several injured tubules are highlighted in yellow. Without this labeling it would be difficult to decide whether some cells (asterisks) are located inside or outside the tubular basement membrane. The higher magnified picture in B clearly allows a separation. PT mouse after 4 days DOX. Scale bars: 10 μm (A); 5 μm (B).
Figure 8
Figure 8
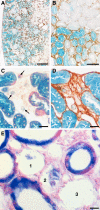
Tracing for tubule derived cells after permanent labeling with LacZ. A and B: LacZ expression shown by β-galactosidase staining co-stained with antibodies to collagen I. Note that the heterogeneous expression of LacZ (indicative of TGF-β expression) perfectly correlates with peritubular collagen deposition (brown). No labeled cells are encountered in peritubular spaces. Overview (A) and detail from a consecutive section (B). C and D show the same area of tubular degeneration in two consecutive sections, in (C) co-stained with eosin, in (D) against collagen type I. The dense collagenous fibrosis of the area is clearly seen in (D). The tubular remnants within this area show a pale staining (arrows in C); no labeled interstitial cells are seen. E: Area of tubular degeneration and interstitial fibrosis. Cells of intact tubules are strongly labeled with β-galactosidase. Three profiles (1,2,3) of degenerating tubules are seen, two of them contain cellular remnants that show a fading staining. Cells in the interstitium are not labeled. PLRT mice (A) and (B) after 4 days, (C) and (D) after six cycles and (E) after three cycles of DOX. Scale bars: 200 μm (A), 50 μm (B), 20 μm (C and D), and 10 μm (E).

Similar articles

Cited by

References

    1. Miettinen P, Ebner R, Lopez A, Derynck R. TGF-beta induced transdifferentiation of mammary epithelial cells to mesenchymal cells: involvement of type I receptors. J Cell Biol. 1994;127:2021–2036. - PMC - PubMed
    1. Fan J, Ng Y, Hill P, Nikolic-Paterson D, Mu W, Atkins R, Lan H. Transforming growth factor-beta regulates tubular epithelial myofibroblast transdifferentiation in vitro. Kidney Int. 1999;56:1455–1467. - PubMed
    1. Zavadil J, Bitzer M, Liang D, Yang Y, Massimi A, Kneitz S, Piek E, Bottinger E. Genetic programs of epithelial cell plasticity directed by transforming growth factor-beta. Proc Natl Acad Sci USA. 2001;98:6686–6691. - PMC - PubMed
    1. Gotzmann J, Mikula M, Eger A, Schulte-Hermann R, Foisner R, Beug H, Mikulits W. Molecular aspects of epithelial cell plasticity: implications for local tumor invasion and metastasis. Mutat Res. 2004;566:9–20. - PubMed
    1. Zeisberg E, Kalluri R. The role of epithelial-to-mesenchymal transition in renal fibrosis. J Mol Med. 2004;82:175–181. - PubMed

Publication types

Substances