. 2010 Oct 28;116(17):3297-310.
doi: 10.1182/blood-2009-12-260851. Epub 2010 Jul 8.

Spatiotemporal organization, regulation, and functions of tractions during neutrophil chemotaxis

Affiliations

Spatiotemporal organization, regulation, and functions of tractions during neutrophil chemotaxis

Myung Eun Shin et al. Blood. .

Abstract

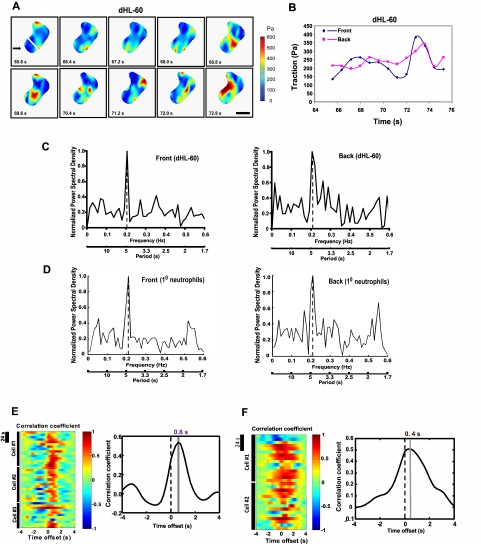
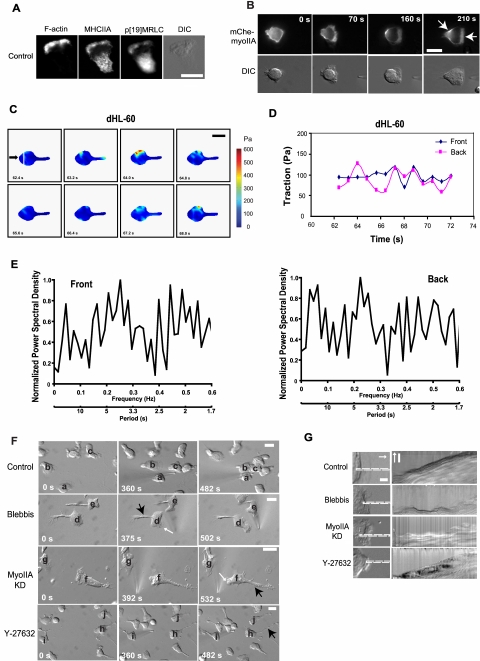
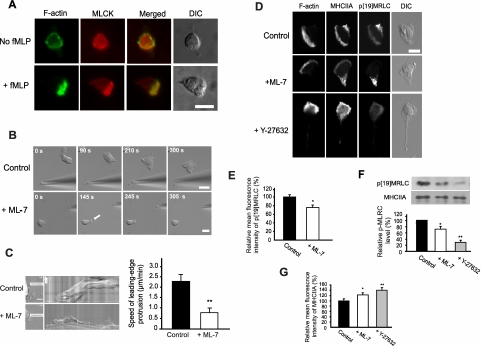
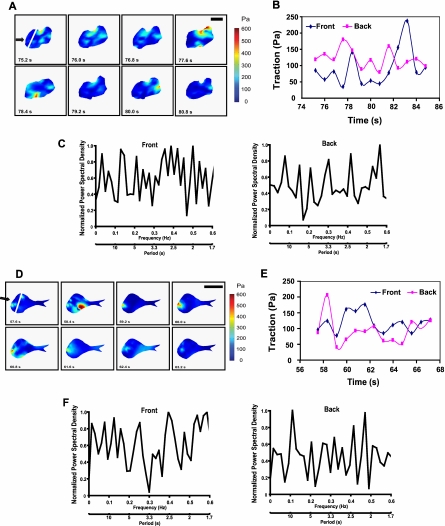
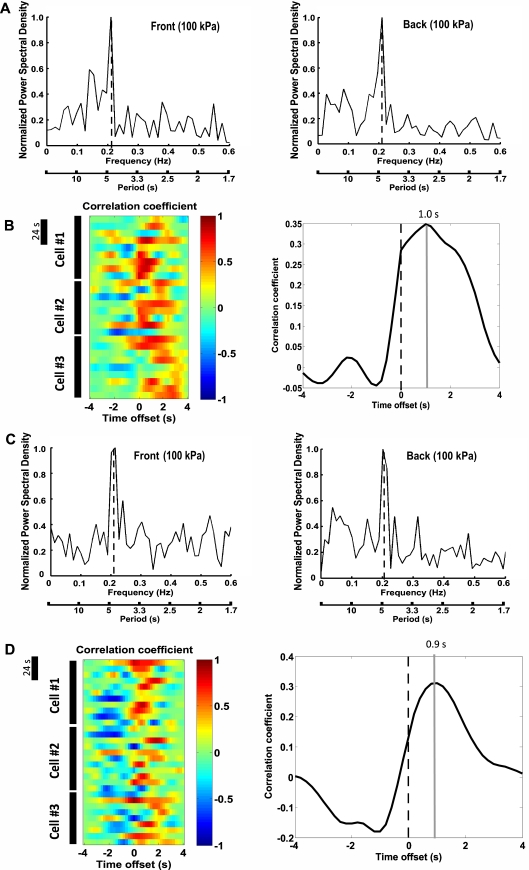
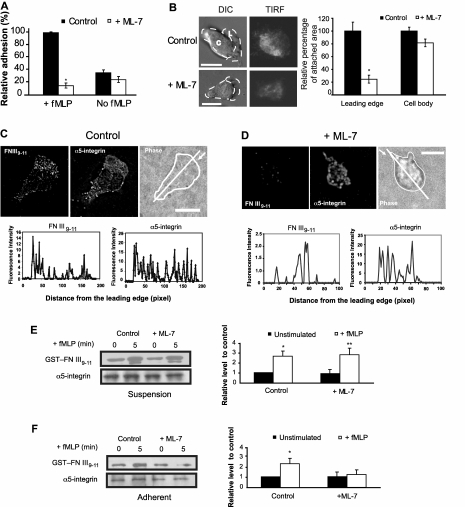
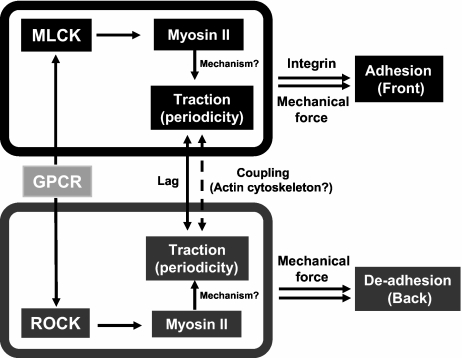
Despite recent advances in our understanding of biochemical regulation of neutrophil chemotaxis, little is known about how mechanical factors control neutrophils' persistent polarity and rapid motility. Here, using a human neutrophil-like cell line and human primary neutrophils, we describe a dynamic spatiotemporal pattern of tractions during chemotaxis. Tractions are located at both the leading and the trailing edge of neutrophils, where they oscillate with a defined periodicity. Interestingly, traction oscillations at the leading and the trailing edge are out of phase with the tractions at the front leading those at the back, suggesting a temporal mechanism that coordinates leading edge and trailing edge activities. The magnitude and periodicity of tractions depend on the activity of nonmuscle myosin IIA. Specifically, traction development at the leading edge requires myosin light chain kinase-mediated myosin II contractility and is necessary for α5β1-integrin activation and leading edge adhesion. Localized myosin II activation induced by spatially activated small GTPase Rho, and its downstream kinase p160-ROCK, as previously reported, leads to contraction of actin-myosin II complexes at the trailing edge, causing it to de-adhere. Our data identify a key biomechanical mechanism for persistent cell polarity and motility.


Figures

Figure 1
Figure 1
Spatiotemporal dynamics of tractions during neutrophil chemotaxis. (A) dHL-60 cells were allowed to migrate toward chemoattractant-containing micropipette (fMLP, 10μM) on a FN-coated elastic polyacrylamide gel for the times indicated. The speed for cell migration is approximately 2.0 μm/minute, lower than the speed of cells on FN-coated glass (∼ 2.4 μm/minute). The cells also exhibit normal tail retraction on the elastic gel (data not shown). Traction maps of the cell are shown. Pseudocolor bar representing tractions is given in Pascal (Pa). Scale bar represents 5 μm. Arrow indicates the direction of fMLP gradient. The leading edge of a polarized neutrophil was defined as the area within the first 3 μm of the cell (marked by a white line), whereas the rest of the cell was defined as the trailing edge (“Polyacrylamide gel substrates, TFM, and data analysis”). The image series shows part (7.2 seconds, for which the cell traveled ∼ 0.24 μm) of the whole migratory response. The video of the cell in panel A is available in supplemental data. (B) Time series of traction maps from panel A (with 3 additional time points) was analyzed by a customized MATLAB program to determine the average tractions in both leading edge (front) and trailing edge (back) of the cells in a time-dependent manner. The graph shows part (∼ 9 seconds) of the whole migratory response. The x-axis indicates time in seconds; y-axis is in Pascal (Pa). The mean levels of tractions at the leading and the trailing edges were comparable. A graph of another cell with a longer migratory response is shown in supplemental Figure 1A. (C) PSD plots of tractions at the leading (left panel) and the trailing edge (right panel) of a migratory dHL-60 cell. PSD plots were generated based on the results from Fourier analysis of the traction values. The y-axis represents the power spectral density normalized to the highest peak value (= 1); x-axis shows the oscillation frequency (Hertz; top) or period (seconds; bottom). Nine cells were analyzed, and a representative cell is shown. PSD plots of tractions in 3 cells combined are shown in supplemental Figure 1B. (D) PSD plots of tractions at the leading edge (left panel) and the trailing edge (right panel) of a migratory primary neutrophil. Six cells were analyzed, and data from a representative cell are shown. (E) Left panel: Cross-correlation between tractions at the leading edge and the trailing edge against time offset during migration for individual dHL-60 cells. Dotted lines indicate zero offset. Note that the back traction lags the front traction as indicated by the maximum cross-correlation at time offset of 0.8 seconds. Data from 3 representative cells are shown. Time bar represents 24 seconds. Right panel: Summary of time offsets between leading edges and trailing edges (n = 9 cells) in dHL-60 cells. (F) Left panel: Cross-correlation between tractions at the leading and the trailing edges against time offset during migration for individual primary neutrophils. Data from 2 representative cells are shown. Right panel: Summary of time offsets between leading edges and trailing edges (n = 6 cells) in primary neutrophils.
Figure 2
Figure 2
Myosin II controls tractions and is necessary for neutrophil chemotaxis. (A) dHL-60 cells were stimulated for 3 minutes by a uniform concentration of 1μM fMLP. Cells were fixed with 3.7% paraformaldehyde and stained with a specific antimyosin heavy chain IIA (MHCIIA) antibody, anti-p[Ser19]MRLC antibody, and rhodamine-conjugated phalloidin to localize filamentous actin (F-actin). The corresponding DIC image is also shown. Scale bar represents 10 μm. (B) dHL-60 cells were transfected with mCherry–myosin IIA (mChe-myoIIA) and stimulated by a micropipette containing 10μM fMLP for the indicated times. mCherry–myosin IIA fluorescence and the corresponding DIC images are shown. Arrows point to the locations of myosin IIA at the leading and trailing edges. Scale bar represents 10 μm. The video of the cell in panel B is available in supplemental data. (C) dHL-60 cells pretreated with blebbistatin (100μM, 30 minutes) were allowed to migrate toward chemoattractant-containing micropipette (fMLP, 10μM) on a FN-coated elastic polyacrylamide gel for the indicated times. Cells treated with blebbistatin migrated at 1.0 μm/minute on the elastic gel. Traction maps of the cell are shown. Pseudocolor bar representing traction force is given in Pascal (Pa). Scale bar represents 10 μm. The leading edge (within the first 2.2 μm of the cell) is marked by a white line (“Polyacrylamide gel substrates, TFM, and data analysis”). The image series shows part (5.6 seconds) of the whole migratory response. (D) Time series of traction maps from panel C (with 4 additional time points) was analyzed by a customized MATLAB program to determine the average tractions in both leading edge (front) and trailing edge (back) of the cells in a time-dependent manner. The graph shows part (∼ 9.6 seconds) of the whole migratory response. The x-axis indicates time in seconds; y-axis is in Pascal (Pa). (E) PSD plots of tractions at the leading edge (left panel) and the trailing edge (right panel) of a migratory cell pretreated with blebbistatin (100μM, 30 minutes). The whole migratory response was analyzed. The y-axis represents the power spectral density normalized to the highest peak value (1); x-axis shows the oscillation frequency (Hertz; top) or period (seconds; bottom). Cells depleted of myosin IIA exhibited similar response (not shown). Ten cells were analyzed, and a representative cell is shown. Additional plots are shown in supplemental Figure 2C. (F) Before exposure to attractant supplied by a micropipette containing 10μM fMLP, cells were not pretreated (control), were pretreated with blebbistatin (Blebbis, 100μM, 30 minutes), were infected with lentivirus-containing myosin IIA–targeting shRNAs (MyoII KD), or were pretreated with Y-27632 (30μM, 30 minutes). The 3 images in each row show the positions of individual cells (each identified with a superimposed letter) after the indicated times of exposure to fMLP. White and black arrows point to the poorly developed leading edges and long stretched tails, respectively. Cells infected with virus containing a scramble shRNA exhibited similar response to uninfected control cells. Lower doses of blebbistatin (≤ 50μM) were tested, which required a prolonged period of incubation to exert the same effects as 100μM blebbistatin (data not shown). Scale bar represents 10 μm. Videos of cells with or without treatments are available in supplemental data. (G) DIC kymographs of a dHL-60 cell untreated or treated with inhibitors or myosin IIA shRNAs migrating toward an fMLP (10μM)–containing micropipette. The left panel shows a portion of the neutrophils' leading edge under various conditions. The dotted rectangles indicate the regions of the cell used to generate the kymographs (before fMLP stimulation). The actual lengths of the rectangles are 20 μm in the direction of the arrow. White scale bar represents 1 μm. The right panel shows the DIC kymographs. White scale bar represents 5 μm. In both panels, white arrows indicate the direction of protrusion. Cells a, d, f, and h in panel F were used for the analysis. Approximately 8 minutes of migration was recorded.
Figure 3
Figure 3
MLCK inhibition/depletion impairs myosin II activity at the leading edge. (A) dHL-60 cells plated on FN-coated coverslips were stimulated for 2 minutes with 1μM fMLP, fixed with 3.7% paraformaldehyde, and stained with a specific anti-MLCK antibody (red) and AlexaFluor-488–conjugated phalloidin (green). The polarized distribution of endogenous MLCK was observed in 188 of 269 polarized cells. (B) A dHL-60 cell treated with ML-7 (25μM, 30 minutes) was exposed to a point source of 10μM fMLP for the times indicated (bottom panel). The cell fails to migrate to the micropipette and shows poorly developed pseudopod (white arrow). An untreated dHL-60 cell (top panel) with well-developed, stable pseudopod is shown. Scale bars represent 10 μm. (C) DIC kymographs (left) of a dHL-60, untreated or treated with ML-7, migrating toward an fMLP (10μM)–containing micropipette. The dotted rectangles indicate the regions of the cell used to generate the kymographs (before fMLP stimulation). The actual lengths of the rectangles are 20 μm in the direction of the arrow. Left panel: Scale bar represents 1 μm. Right panel: Scale bars represent 5 μm. Arrows indicate the direction of protrusion. Five minutes of migration was recorded. The speed of leading-edge protrusion was calculated based on the kymographs (right). The values are mean plus or minus SEM (n = 34 for control, and 32 for cells treated with ML-7). *Value for cells with ML-7 treatment differs from the corresponding control (P < .0001). (D) dHL-60 cells not pretreated or pretreated with ML-7 (25μM, 30 minutes) or Y-27632 (30μM, 30 minutes) were stimulated for 3 minutes by a uniform concentration of 1μM fMLP. Cells were fixed with 3.7% paraformaldehyde and stained with the anti-MHCIIA antibody, anti-p[Ser19]MRLC antibody, and rhodamine-conjugated phalloidin. The corresponding DIC images are also shown. Scale bar represents 10 μm. (E) The distribution of p[Ser19]MRLC in dHL-60 cells with or without ML-7 treatment was analyzed. The mean fluorescence of p[Ser19]MRLC staining at the leading edge and the trailing edge of cells was determined using ImageJ software 1.43, and the ratios between the leading edge and the trailing edge (ie, mean fluorescence intensity at the leading edge/mean fluorescence intensity at the trailing edge) are shown. Values were normalized to the ratio (100%) in control cells and are mean plus or minus SEM (n = 40 for control, and 30 for cells treated with ML-7). Student t tests compared data between experimental groups. *Results significantly different from control (P < .001). (F) Western blot of p[Ser19]MRLC. dHL-60 cells were pretreated with no inhibitors, ML-7 (25μM, 30 minutes), or Y-276322 (30μM, 30 minutes) before exposure to fMLP for 2 minutes in suspension. (Top panel) A typical blot. (Bottom panel) Quantification of blots from 4 separate experiments. Each bar represents the mean plus or minus SEM (error bars). All values were normalized to the signal (100%) detected without the inhibitors. Value for cells treated with M-7 or Y-27632 differs statistically from the control: *P < .01, **P < .001. Total MHCIIA levels were unaltered with the treatments and were used for equal loading in the different lanes. (G) The distribution of total MHCIIA in control dHL-60 cells and cells pretreated with ML-7 or Y-27632 was analyzed. The mean fluorescence of MHCIIA staining at leading and trailing edges was assessed by ImageJ software 1.43, and the ratios between leading and trailing edges are shown. Values were normalized to the ratio (100%) in control cells and are mean plus or minus SEM (n = 40 for control, 30 for cells treated with ML-7, and 25 for cells treated with Y-27632). Results significantly different from control: *P < .05, **P < .001.
Figure 4
Figure 4
Localization-specific myosin activities are necessary for tractions in neutrophils. (A) dHL-60 cells depleted of MLCK were allowed to migrate toward chemoattractant-containing micropipette (fMLP, 10μM) on a FN-coated elastic polyacrylamide gel for the indicated times. Traction maps of the cell are shown. Pseudocolor bar representing tractions is given in Pascal (Pa). Scale bar represents 5 μm. The leading edge (within the first 2.2 μm of the cell) is marked by a white line. The image series shows part (5.6 seconds) of the whole migratory response. Cells treated with ML-7 exhibited similar responses. Cells treated with ML-7 or depleted of MLCK migrated at 1.1 μm/minute on the elastic gel. The video of the cell in panel A is available in supplemental data. (B) Time series of traction maps from panel A (with 5 additional time points) was analyzed by a customized MATLAB program to determine the average traction force in both leading edge (front) and trailing edge (back) of the cells in a time-dependent manner. The graph shows part (∼ 9.6 seconds) of the whole migratory response. The x-axis indicates time in seconds; y-axis is in Pascal (Pa). (C) PSD plots of tractions at the leading edge (left panel) and the trailing edge (right panel) of a migratory cell depleted of MLCK. The whole migratory response was analyzed. The y-axis represents the power spectral density normalized to the highest peak value (1); x-axis shows the oscillation frequency (Hertz; top) or period (seconds; bottom). Cells pretreated with ML-7 exhibited similar response (not shown). Ten cells were analyzed, and a representative cell is shown. Additional plots for ML-7 treatment and MLCK depletion are shown in supplemental Figure 9A and B. (D) dHL-60 cells pretreated with Y-27632 (30 μm, 30 minutes) were allowed to migrate toward chemoattractant-containing micropipette (fMLP, 10μM) on a FN-coated elastic polyacrylamide gel for the indicated times. Traction force maps of the cell are shown. Pseudocolor bar representing traction force is given in Pascal (Pa). Scale bar represents 10 μm. The leading edge (within the first 3 μm of the cell) is marked by a white line (“Polyacrylamide gel substrates, TFM, and data analysis”). The image series shows part (5.6 seconds) of the whole migratory response. (E) Time series of traction maps from panel D (with 5 additional time points) was analyzed by a customized MATLAB program to determine the average traction force in both leading edge (front) and trailing edge (back) of the cells in a time-dependent manner. The graph shows part (∼ 9.6 seconds) of the whole migratory response. The x-axis indicates time in seconds; y-axis is in Pascal (Pa). (F) PSD plots of tractions at the leading edge (left panel) and the trailing edge (right panel) of a migratory cell pretreated with Y-27632. The whole migratory response was analyzed. The y-axis represents the power spectral density normalized to the highest peak value (1); x-axis shows the oscillation frequency (Hertz; top) or period (seconds; bottom). Eight cells were analyzed, and a representative cell is shown. Additional plots are shown in supplemental Figure 9C.
Figure 5
Figure 5
The pattern and regulation of tractions in neutrophils migrating on a stiffer substrate. (A) PSD plots of tractions at the leading edge (left panel) and the trailing edge (right panel) of a migratory primary neutrophil. PSD plots were generated based on the results from Fourier analysis of the traction values. The y-axis represents the PSD normalized to the highest peak value (1). The x-axis shows the oscillation frequency (Hertz; top) or period (seconds; bottom). Primary cells were allowed to migrate toward chemoattractant-containing micropipette (fMLP, 10μM) on a FN-coated polyacrylamide gel (100 kPa) for 4 to 5 minutes. Six cells were analyzed, and a representative cell is shown. (B) Left panel: Cross-correlation between tractions at the leading edge and the trailing edge against time offset during migration for individual primary neutrophils. Dotted lines indicate zero offset. Data from 3 representative cells are shown. Time bar represents 24 seconds. Right panel: Summary of time offsets between leading edges and trailing edges (n = 6 cells) in primary cells. (C) PSD plots of tractions at the leading edge (left panel) and the trailing edge (right panel) of a migratory primary neutrophil pretreated with Y-27632 (30μM, 30 minutes). PSD plots were generated based on the results from Fourier analysis of the traction values. The y-axis represents the PSD normalized to the highest peak value (1). The x-axis shows the oscillation frequency (Hertz; top) or period (seconds; bottom). Cells were allowed to migrate toward chemoattractant-containing micropipette (fMLP, 10μM) on a FN-coated polyacrylamide gel (100 kPa) for 4 to 5 minutes. Six cells were analyzed, and a representative cell is shown. (D) Left panel: Cross-correlation between tractions at the leading edge and the trailing edge against time offset during migration for individual Y-27632–treated primary neutrophils. Dotted lines indicate zero offset. Data from 3 representative cells are shown. Time bar represents 24 seconds. Right panel: Summary of time offsets between leading edges and trailing edges (n = 6 cells) in Y-27632–treated primary cells.
Figure 6
Figure 6
MLCK controls neutrophil adhesion and integrin activation. (A) dHL-60 cells pretreated with (25μM, 30 minutes) or without ML-7 were not stimulated or stimulated in suspension by 1μM fMLP and allowed to adhere to FN-coated surface for 30 minutes, after which the degree of cell adhesion was assessed. Values were normalized to adhesion in control cells (100%) with fMLP and are mean plus or minus SEM (n = 4). *Results significantly different from control (P < .001). (B) Assessment of adhesion area in leading edge and cell body in control and ML-7–treated cells transfected with EGFP-α5-integrin and exposed to a point source of 10μM fMLP. Cell images were from supplemental Figure 13. Left panel: The time point at which leading edge protrusion of individual cells was maximal was selected for analysis. Leading edge (denoted as “L”) in TIRF image was demarcated by the corresponding DIC image, and the rest of the cell was defined as cell body (denoted as “C”). Right panel: Fluorescence intensities of the leading edge and the cell body in the TIRF images of control and ML-7–treated cells were determined with ImageJ software 1.43, and the resulting values were used to quantify cell attachment of the both leading edge and the cell body. The plot shows the relative values in each region compared with control (100%) in the presence of fMLP stimulation. Values are mean plus or minus SEM (n = 13 for control, 11 for cells treated with ML-7). *Results significantly different from control (P < .0001). (C-D) Top panel: Localization of activated α5β1-integrins in polarized neutrophils pretreated with or without ML-7 (25μM, 30 minutes). dHL-60 cells pretreated with or without ML-7 were plated on FN-coated coverslips and stimulated for 3 minutes by 1μM fMLP. After washing, cells were fixed with 3.7% paraformaldehyde, incubated with GST-FN III9-11 (50 μg/mL) for 15 minutes at 37°C, and stained with an anti-GST antibody and anti–α5-integrin antibody. Fluorescent and phase-contrast images were collected using confocal fluorescence microscopy. The images of a representative cell for each condition are shown (n = 20 for control and n = 17 for ML-7 treatment). Arrows indicate the leading edge. White line indicates the path along which line profile was obtained. The weak signals for GST-FN III9-11 binding may be attributed to the relative low levels of activated α5β1-integrin in the cells. Scale bar represents 10 μm. Bottom panel: Line profiles of GST-FN III9-11 and α5-integrin fluorescence in cells shown in the top panel. The graphs plot fluorescence intensity of each protein (y-axis; in arbitrary units) versus distance (x-axis in pixels) along the white line on the phase-contrast image of the cells. (E-F) Levels of activated α5β1-integrins in cells with or without ML-7 treatment. dHL-60 cells pretreated with or without ML-7 were stimulated by a uniform concentration of fMLP (1μM) in either suspension (E) or adhesion conditions (F). A typical blot is shown on the left. (Right panel) Quantification of blots from 4 separate experiments. The y-axis represents relative intensities (measured with ImageJ software 1.43) with values normalized to the signal (1) detected in the control cells without ML-7 treatment. Each bar represents the mean plus or minus SEM (n = 4). Results significantly different from those of cells without fMLP stimulation: *P < .0001, **P < .001.
Figure 7
Figure 7
Integration of mechanical and biochemical signals to regulate leading edge adhesion and trailing edge de-adhesion: a model. The model is proposed based on analyses of cell migration on the 3.5-kPa substrate. GPCR indicates G protein-coupled receptor.

Similar articles

Cited by

References

    1. Srinivasan S, Wang F, Glavas S, et al. Rac and Cdc42 play distinct roles in regulating PI(3,4,5)P3 and polarity during neutrophil chemotaxis. J Cell Biol. 2003;160(3):375–385. - PMC - PubMed
    1. Wang F, Herzmark P, Weiner OD, Srinivasan S, Servant G, Bourne HR. Lipid products of PI(3)Ks maintain persistent cell polarity and directed motility in neutrophils. Nat Cell Biol. 2002;4(7):513–518. - PubMed
    1. Wong K, Pertz O, Hahn K, Bourne H. Neutrophil polarization: spatiotemporal dynamics of RhoA activity support a self-organizing mechanism. Proc Natl Acad Sci U S A. 2006;103(10):3639–3644. - PMC - PubMed
    1. Xu J, Wang F, Van Keymeulen A, et al. Divergent signals and cytoskeletal assemblies regulate self-organizing polarity in neutrophils. Cell. 2003;114(2):201–214. - PubMed
    1. Rottner K, Hall A, Small JV. Interplay between Rac and Rho in the control of substrate contact dynamics. Curr Biol. 1999;9(12):640–649. - PubMed

Publication types