Structural mechanism of C-type inactivation in K(+) channels
- PMID: 20613835
- PMCID: PMC3033749
- DOI: 10.1038/nature09153
Structural mechanism of C-type inactivation in K(+) channels
Abstract
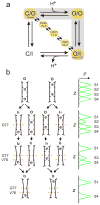
Interconversion between conductive and non-conductive forms of the K(+) channel selectivity filter underlies a variety of gating events, from flicker transitions (at the microsecond timescale) to C-type inactivation (millisecond to second timescale). Here we report the crystal structure of the Streptomyces lividans K(+) channel KcsA in its open-inactivated conformation and investigate the mechanism of C-type inactivation gating at the selectivity filter from channels 'trapped' in a series of partially open conformations. Five conformer classes were identified with openings ranging from 12 A in closed KcsA (Calpha-Calpha distances at Thr 112) to 32 A when fully open. They revealed a remarkable correlation between the degree of gate opening and the conformation and ion occupancy of the selectivity filter. We show that a gradual filter backbone reorientation leads first to a loss of the S2 ion binding site and a subsequent loss of the S3 binding site, presumably abrogating ion conduction. These structures indicate a molecular basis for C-type inactivation in K(+) channels.
Figures


Similar articles
-
Structural basis for the coupling between activation and inactivation gates in K(+) channels.Nature. 2010 Jul 8;466(7303):272-5. doi: 10.1038/nature09136. Nature. 2010. PMID: 20613845 Free PMC article.
-
Recovery from slow inactivation in K+ channels is controlled by water molecules.Nature. 2013 Sep 5;501(7465):121-4. doi: 10.1038/nature12395. Epub 2013 Jul 28. Nature. 2013. PMID: 23892782 Free PMC article.
-
Molecular determinants of gating at the potassium-channel selectivity filter.Nat Struct Mol Biol. 2006 Apr;13(4):311-8. doi: 10.1038/nsmb1069. Epub 2006 Mar 12. Nat Struct Mol Biol. 2006. PMID: 16532009
-
The potassium channel KcsA and its interaction with the lipid bilayer.Cell Mol Life Sci. 2003 Aug;60(8):1581-90. doi: 10.1007/s00018-003-3172-y. Cell Mol Life Sci. 2003. PMID: 14513833 Free PMC article. Review.
-
EPR approaches to ion channel structure and function.Novartis Found Symp. 2002;245:146-58; discussion 158-64, 165-8. doi: 10.1002/0470868759.ch10. Novartis Found Symp. 2002. PMID: 12027005 Review.
Cited by
-
Mathematical models of C-type and N-type inactivating heteromeric voltage gated potassium channels.Front Cell Neurosci. 2024 Oct 8;18:1418125. doi: 10.3389/fncel.2024.1418125. eCollection 2024. Front Cell Neurosci. 2024. PMID: 39440001 Free PMC article.
-
A physical derivation of high-flux ion transport in biological channel via quantum ion coherence.Nat Commun. 2024 Aug 21;15(1):7189. doi: 10.1038/s41467-024-51045-x. Nat Commun. 2024. PMID: 39168976 Free PMC article.
-
Verapamil- and state-dependent effect of 2-aminoethylmethanethiosulphonate (MTSEA) on hK(v)1.3 channels.Br J Pharmacol. 2012 Nov;167(6):1378-88. doi: 10.1111/j.1476-5381.2012.02092.x. Br J Pharmacol. 2012. PMID: 22748056 Free PMC article.
-
Structure of mechanically activated ion channel OSCA2.3 reveals mobile elements in the transmembrane domain.Structure. 2024 Feb 1;32(2):157-167.e5. doi: 10.1016/j.str.2023.11.009. Epub 2023 Dec 15. Structure. 2024. PMID: 38103547
-
Proton sensors in the pore domain of the cardiac voltage-gated sodium channel.J Biol Chem. 2013 Feb 15;288(7):4782-91. doi: 10.1074/jbc.M112.434266. Epub 2013 Jan 2. J Biol Chem. 2013. PMID: 23283979 Free PMC article.
References
-
- Doyle DA, et al. The structure of the potassium channel: molecular basis of K+ conduction and selectivity. Science. 1998;280:69–77. - PubMed
-
- Kuo A, et al. Crystal structure of the potassium channel KirBac1.1 in the closed state. Science. 2003;300:1922–1926. - PubMed
-
- Jiang Y, et al. The open pore conformation of potassium channels. Nature. 2002;417:523–526. - PubMed
-
- Long SB, Campbell EB, Mackinnon R. Crystal structure of a mammalian voltage-dependent Shaker family K+ channel. Science. 2005;309:897–903. - PubMed
Publication types
MeSH terms
Substances
Associated data
- Actions
- Actions
- Actions
- Actions
- Actions
Grants and funding
LinkOut - more resources
Full Text Sources
Molecular Biology Databases

