. 2010 Sep;89(9):661-73.
doi: 10.1016/j.ejcb.2010.05.003.

Studies on the morphology and spreading of human endothelial cells define key inter- and intramolecular interactions for talin1

Affiliations

Studies on the morphology and spreading of human endothelial cells define key inter- and intramolecular interactions for talin1

Petra M Kopp et al. Eur J Cell Biol. 2010 Sep.

Abstract

Talin binds to and activates integrins and is thought to couple them to cytoskeletal actin. However, functional studies on talin have been restricted by the fact that most cells express two talin isoforms. Here we show that human umbilical vein endothelial cells (HUVEC) express only talin1, and that talin1 knockdown inhibited focal adhesion (FA) assembly preventing the cells from maintaining a spread morphology, a phenotype that was rescued by GFP-mouse talin1. Thus HUVEC offer an ideal model system in which to conduct talin structure/function studies. Talin contains an N-terminal FERM domain (comprised of F1, F2 and F3 domains) and a C-terminal flexible rod. The F3 FERM domain binds beta-integrin tails, and mutations in F3 that inhibited integrin binding (W359A) or activation (L325R) severely compromised the ability of GFP-talin1 to rescue the talin1 knockdown phenotype despite the presence of a second integrin-binding site in the talin rod. The talin rod contains several actin-binding sites (ABS), and mutations in the C-terminal ABS that reduced actin-binding impaired talin1 function, whereas those that increased binding resulted in more stable FAs. The results show that both the N-terminal integrin and C-terminal actin-binding functions of talin are essential to cell spreading and FA assembly. Finally, mutations that relieve talin auto-inhibition resulted in the rapid and excessive production of FA, highlighting the importance of talin regulation within the cell.


Figures

Fig. S1
Fig. S1
Analysis of MEFs for talin structure function studies. (A) Western blots of Tln1fl/fl; CreER/+ MEF lysates 72 h after treatment with 100 nM 4-hydroxy tamoxifen (4OHT) or ethanol (EtOH) probed with talin 1 and 2 specific antibodies with vinculin as a loading control. (B) Numbers of GFP- or paxillin-containing FA in Tln1fl/fl; CreER/+ MEF 72 h after treatment with 100 nM 4OHT and either untransfected or transfected as shown. Results are expressed as mean ± s.e.m. (C) Different batches of primary MEFs differ in their phenotype before and after treatment with 4OHT. (Top panels) Brightfield images of two different Tln1fl/fl; CreER/+ MEF lines 96 h after treatment with either ethanol (EtOH) or 100 nM 4OHT. (Bottom panels) Western blot of lysates of same MEF lines 24 h or 96 h after treatment with either ethanol (−) or 100 nM 4OHT (+). Vinculin was used as a loading control.
Fig. S2
Fig. S2
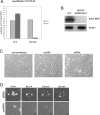
Use of HUVEC for talin1 knockdown. (A) Quantitative RT-PCR of talin1/talin2 expression in either hFF or HUVEC. (B) Western blot of cell lysate from hFFs or HUVECs transfected with talin1 siRNA for 72 h. Tubulin was loading control. (C) Phase micrographs of HUVEC either untransfected or transfected with conRNA or talin1 siRNA for 72 h and replated onto glass for 24 h. (D) HUVEC transfected with either a talin1 siRNA or conRNA were replated on glass coverslips 72 h post transfection. Brightfield images were recorded at the times indicated. Scale bars, 10 μm. For talin 1 siRNA transfected cells, 3 out of the 6 cells shown were able to adhere and spread initially, but they started to arborize after 150 min or could not maintain spreading. Three cells failed to spread at all.
Fig. S3
Fig. S3
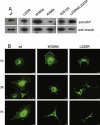
Transfection of HUVEC with talin1 siRNA and talin1-GFP constructs (A) Western blots of lysates of HUVEC transfected with talin1 siRNA and GFP-talin1 constructs as indicated, detected with anti GFP-antibody. Vinculin was used as loading control. (B) Time course of spreading of HUVEC transfected with wild-type GFP-talin1 or constructs with point mutations as indicated, replated 72 h post transfection, fixed after 1 h (top row), 3 h (middle row) or 7 h (bottom row). All cells spread normally during the first hour, after 7 h only the wild-type transfected cells are spread, with the majority of cells expressing mutant GFP-talin1 constructs show an arborized morphology. Scale bars: 10 μm.
Fig. S4
Fig. S4
Focal adhesion formation in HUVEC (A) Confocal time-lapse microscopy of HUVEC transfected with talin1 siRNA and the GFP-talin1 constructs indicated 72 h post transfection. The GFP-talin1 L325R mutant localises to highly dynamic lamellae compared to wild-type GFP-talin1. The GFP-talin1 L2309A/L2323A localised to rather stable FAs. The position of the GFP-tagged proteins at 0 min (green) and 6 min (red) are overlaid in the right hand panels. (B) HUVEC were transfected with the talin1 siRNA and either wild-type GFP-talin1 or the GFP-talin1 T1767E or E1770A mutants. FA size was quantified using ImageJ and expressed as mean ± s.e.m. Scale bars: 10 μm.
Fig. 1
Fig. 1
siRNA knockdown of talin1 in HUVEC abolishes FA assembly. (A) Left panel: Western blots of cell lysates from human foreskin fibroblasts (hFF) and HUVEC probed with antibodies specific for talin1 (TA205) and talin2 (mAb121A(53)). Anti-tubulin was used as a loading control. Right panel: RT-PCR amplification of mRNA from hFF or HUVEC (30 cycles) using primers specific for TLN1 (exons 33–34) and TLN2 (exons 54–55). H2O, control. RT(+) reverse or RT(−) non-reverse transcribed mRNA. (B) Confocal images of HUVEC stained with antibodies specific for talin1 (97H6, left) and talin2 (68E7, right). Scale bar: 10 μm. (C) Western blot of HUVEC treated with a talin1 or control siRNA (conRNA) for 24–96 h; cell lysates were probed with anti-talin1 (97H6), with anti-vinculin as a loading control. (D) HUVEC treated with a talin1 siRNA or conRNA were replated onto glass coverslips 48 h after transfection, and stained 24 h later for paxillin. Scale bar: 10 μm. (E) Epifluorescence image of HUVEC treated as in (D) and stained for F-actin with TexasRed phalloidin (red) and for talin1 with mAb 97H6 (green). Scale bars: 10 μm (For interpretation of the references to colour in this figure legend, the reader is referred to the web version of the article).
Fig. 2
Fig. 2
Effects of talin1 knockdown on cell spreading. HUVEC transfected with either the talin1 siRNA or conRNA were replated 72 h after transfection on tissue culture plastic, and imaged every 15 min for the times indicated. (A) The percentage of spread cells was recorded from 3 experiments; mean ± s.e.m. (B) The areas of 12 cells each from two experiments were measured using ImageJ. Results are expressed as mean ± s.e.m. (C) Quantitative analysis of cell morphology at various time points after replating (expressed as mean ± s.e.m.) using the criteria described in Methods. “Spread cell” (white filled arrow in D). “Arborized” (white empty arrow in D). “Elongated” (black filled arrow in D). “Not spread” (black empty arrow in D). n = 300 for each time point/sample. (D) HUVEC were imaged every 15 min for 18 h, and three representative cells tracked using the manual tracker tool plugin for ImageJ. Scale bar, 10 μm. (E) Migration plots of HUVEC as in (D). For each plot 25 cells were tracked using the Manual Tracker and Chemotaxis Tool plugins for ImageJ. (F) Quantitation of migration parameters from (E) expressed as mean ± s.e.m. Asterisks represent a significant difference between the two groups. p-values are shown under each graph.
Fig. 3
Fig. 3
GFP-talin1 or talin2 rescues cell spreading and FA formation in talin1-depleted HUVEC. Cells were transfected with a talin1 siRNA or conRNA plus constructs encoding either GFP alone, mouse talin1-GFP or human talin2-GFP. Cells were replated on glass coverslips 72 h after transfection. (A) Epifluorescence images showing GFP localisation in cells 24 h after replating. (B, C) Time course of changes in cell morphology (B) and cell area (C). (D, E) FA number (D) and size (E) in different cell populations quantified using ImageJ. All results are expressed as mean ± s.e.m. Scale bars: 10 μm.
Fig. 4
Fig. 4
Mutations in the talin1 FERM domain affect cell spreading. HUVEC were transfected with a talin1 siRNA or conRNA plus constructs encoding either GFP alone, wild-type GFP-talin1 (wt) or GFP-talin1 containing point mutations in the FERM domain. Cells were replated on glass coverslips 72 h post transfection and imaged or fixed/stained 24 h later. (A) Structure of the F3 domain of talin1 (green) complexed with the cytoplasmic tail of β3-integrin (red). Side chains of key residues are shown. (B) Epifluorescence images showing GFP localisation 24 h after plating. (C) Cell morphology quantified at 24 h after replating. (D–F) Cell area (D), and the number (E) and size (F) of FA quantified using ImageJ 24 h after replating. (G, H) Time course of cell spreading based on either (G) cell morphology or (H) cell area. All results are expressed as mean ± s.e.m. p-values compared to wt at 24 h: Cell area; p = 0.0001 (R358A, W359A and L325R). Number of FA; p = 0.003 (R358A); p = 0..0001 (W359A & L325R). FA size; ns (R358A); p = 0.001 (R358A) p = 0.006 (L325R). Scale bars: 10 μm (For interpretation of the references to colour in this figure legend, the reader is referred to the web version of the article).
Fig. 5
Fig. 5
Mutations in the talin1 C-ABS affect cell spreading and FA assembly. HUVEC were transfected with a talin1 siRNA plus constructs encoding either wild-type or GFP-talin1 with point mutations in the C-ABS. Cells were replated on glass coverslips 72 h post transfection, and imaged then fixed/stained 24 h later. (A) Schematic diagram of the dimeric C-ABS of talin1 showing the 5-helix bundle (THATCH domain), the dimerisation domain, and the actin-binding surface. Residues mutated are indicated. (B) Epifluorescence images showing localisation of the various GFP-talin1 constructs 24 h after replating. (C, D) Cell spreading was quantified 24 h after replating onto glass coverslips and was based on cell morphology (C) or cell area (D). (E, F) Quantification of FA size (E) and number (F). (G–H) Time course of cell spreading based on cell morphology (G) or cell area (H). (I) FRAP analysis of FAs in cells expressing either wild-type GFP-talin1 or a GFP-talin1 L2309A/L2323A mutant. Left panel shows averaged curves of normalized fluorescence intensities over time (>10 adhesions from different cells) with regression analysis to illustrate the rate of recovery of GFP-tagged talin1 to the bleached region of FA. Bar charts represent the mobile fraction (middle) and half-life (right) of the GFP-tagged constructs in the FA. All results are expressed as mean ± s.e.m. p-values compared to wt at 24 h: Cell area; p = 0.004 (R2510A). Number of FA; p = 0.0001 (R2510A); p = 0.001 (LL). FA size; ns (R2510A); p = 0.0004 (LL); FRAP LL; mobile fraction p = 0.0001, t1/2 p = 0.07. Scale bars: 10 μm.
Fig. 6
Fig. 6
Mutations that relieve talin1 auto-inhibition lead to the rapid assembly of FA. HUVEC were transfected with a talin1 siRNA plus constructs encoding either wild-type GFP-talin1 (wt) or GFP-talin1 rod domain mutants (T1676E or E1770A) that disrupt talin auto-inhibition. Cells were replated on glass coverslips 72 h post transfection, and imaged then fixed/stained 24 h later. (A) Epifluorescence images showing GFP-talin1 localisation 24 h after plating. (B) Diagram of the intramolecular interaction between the F3 FERM domain (green) and residues 1655–1822 in the talin rod (blue). (C, D) Time course of cell spreading following replating onto glass coverslips based on cell morphology (C) or cell area (D). (E) Time course of FA formation. (F) Epifluorescence images of cells 30 min after replating showing localisation of the GFP-talin1 constructs. All results are expressed as mean ± s.e.m. p-values compared to wt at 24 h: Cell area; p = 0.4 (T1767E, E1770A). Number of FA; p = 0.0001 (T1767E, E1770A). Scale bars: 10 μm (For interpretation of the references to colour in this figure legend, the reader is referred to the web version of the article).
Fig. 7
Fig. 7
Interactions between talin and its binding partners in FA. (A) Mutations analysed in this study mapped on to the domain structure of talin. (B) Clusters of basic residues in the N-terminal talin1 F1, F2 and F3 FERM domains are shown interacting with acidic membrane phospholipids whilst the F3 domain binds β-integrin tails. The FERM domain is linked to the rod by a flexible linker. The C-ABS is shown bound to a single actin filament. The auto-inhibited form of talin1 is also shown and possible modes of activation are indicated.

Similar articles

Cited by

References

    1. Albiges-Rizo C., Frachet P., Block M.R. Down regulation of talin alters cell adhesion and the processing of the a5b1 integrin. J. Cell Sci. 1995;108:3317–3329. - PubMed
    1. Anthis N.J., Wegener K.L., Ye F., Kim C., Goult B.T., Lowe E.D., Vakonakis I., Bate N., Critchley D.R., Ginsberg M.H., Campbell I.D. The structure of an integrin/talin complex reveals the basis of inside-out signal transduction. EMBO J. 2009;28:3623–3632. - PMC - PubMed
    1. Arias-Salgado E.G., Lizano S., Shattil S.J., Ginsberg M.H. Specification of the direction of adhesive signaling by the integrin beta cytoplasmic domain. J. Biol. Chem. 2005;280:29699–29707. - PubMed
    1. Bolton S.J., Barry S.T., Mosley H., Patel B., Jockusch B., Wilkinson J.M., Critchley D.R. Monoclonal antibodies recognizing the N- and C-terminal regions of talin disrupt actin stress fibers when microinjected into human fibroblasts. Cell Motil. Cytoskeleton. 1997;36:363–376. - PubMed
    1. Bouaouina M., Lad Y., Calderwood D.A. The N-terminal domains of talin cooperate with the phosphotyrosine binding-like domain to activate beta1 and beta3 integrins. J. Biol. Chem. 2008;283:6118–6125. - PubMed

Publication types

MeSH terms