progressiveMauve: multiple genome alignment with gene gain, loss and rearrangement
- PMID: 20593022
- PMCID: PMC2892488
- DOI: 10.1371/journal.pone.0011147
progressiveMauve: multiple genome alignment with gene gain, loss and rearrangement
Abstract
Background: Multiple genome alignment remains a challenging problem. Effects of recombination including rearrangement, segmental duplication, gain, and loss can create a mosaic pattern of homology even among closely related organisms.
Methodology/principal findings: We describe a new method to align two or more genomes that have undergone rearrangements due to recombination and substantial amounts of segmental gain and loss (flux). We demonstrate that the new method can accurately align regions conserved in some, but not all, of the genomes, an important case not handled by our previous work. The method uses a novel alignment objective score called a sum-of-pairs breakpoint score, which facilitates accurate detection of rearrangement breakpoints when genomes have unequal gene content. We also apply a probabilistic alignment filtering method to remove erroneous alignments of unrelated sequences, which are commonly observed in other genome alignment methods. We describe new metrics for quantifying genome alignment accuracy which measure the quality of rearrangement breakpoint predictions and indel predictions. The new genome alignment algorithm demonstrates high accuracy in situations where genomes have undergone biologically feasible amounts of genome rearrangement, segmental gain and loss. We apply the new algorithm to a set of 23 genomes from the genera Escherichia, Shigella, and Salmonella. Analysis of whole-genome multiple alignments allows us to extend the previously defined concepts of core- and pan-genomes to include not only annotated genes, but also non-coding regions with potential regulatory roles. The 23 enterobacteria have an estimated core-genome of 2.46Mbp conserved among all taxa and a pan-genome of 15.2Mbp. We document substantial population-level variability among these organisms driven by segmental gain and loss. Interestingly, much variability lies in intergenic regions, suggesting that the Enterobacteriacae may exhibit regulatory divergence.
Conclusions: The multiple genome alignments generated by our software provide a platform for comparative genomic and population genomic studies. Free, open-source software implementing the described genome alignment approach is available from http://gel.ahabs.wisc.edu/mauve.
Conflict of interest statement
Figures


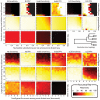
 -axis and the substitution rate along the
  -axis. The most distant taxa have 0.05 indels per site. progressiveMauve clearly outperforms mauveAligner 1.3.0 over the entire space of inversion rates. It should be noted that in applications such as the UCSC browser alignments TBA was used in conjuction with a separate synteny-mapping method to identify rearrangements , so the performance results given here are not cause for alarm. Experiments at bottom quantify aligner performance in the presence of small- and large-scale gain and loss events. The
  -axis gives the average number of large gain and loss events [length
 Unif(10kbp, 50kbp)] between the most distant taxa, while the
  -axis gives small gain and loss events [length
 Geo(200bp)]. Substitution and indel rates are those indicated by the asterisk in Figure 5, and the most distant taxa have 42 inversions on average. The asterisk in this figure indicates a simulation scenario expected to be similar to our 23 target genomes. Once again progressiveMauve outperforms other methods, but all methods break down when faced with substantial large-scale gain and loss. Of note, when mauveAligner 1.3.0 attains high PPV it usually does so with very poor sensitivity.


Similar articles
-
Mauve: multiple alignment of conserved genomic sequence with rearrangements.Genome Res. 2004 Jul;14(7):1394-403. doi: 10.1101/gr.2289704. Genome Res. 2004. PMID: 15231754 Free PMC article.
-
GR-Aligner: an algorithm for aligning pairwise genomic sequences containing rearrangement events.Bioinformatics. 2009 Sep 1;25(17):2188-93. doi: 10.1093/bioinformatics/btp372. Epub 2009 Jun 19. Bioinformatics. 2009. PMID: 19542149
-
Design of multiple sequence alignment algorithms on parallel, distributed memory supercomputers.Annu Int Conf IEEE Eng Med Biol Soc. 2011;2011:924-7. doi: 10.1109/IEMBS.2011.6090208. Annu Int Conf IEEE Eng Med Biol Soc. 2011. PMID: 22254462
-
StartLink and StartLink+: Prediction of Gene Starts in Prokaryotic Genomes.Front Bioinform. 2021 Dec 9;1:704157. doi: 10.3389/fbinf.2021.704157. eCollection 2021. Front Bioinform. 2021. PMID: 36303749 Free PMC article. Review.
-
Multiple genome alignment in the telomere-to-telomere assembly era.Genome Biol. 2022 Aug 29;23(1):182. doi: 10.1186/s13059-022-02735-6. Genome Biol. 2022. PMID: 36038949 Free PMC article. Review.
Cited by
-
Draft Genome Sequence of Erythromycin-Resistant Streptococcus gallolyticus subsp. gallolyticus NTS 31106099 Isolated from a Patient with Infective Endocarditis and Colorectal Cancer.Genome Announc. 2015 Apr 23;3(2):e00370-15. doi: 10.1128/genomeA.00370-15. Genome Announc. 2015. PMID: 25908147 Free PMC article.
-
Whole-Genome Sequence Analysis and Genome-Wide Virulence Gene Identification of Riemerella anatipestifer Strain Yb2.Appl Environ Microbiol. 2015 Aug;81(15):5093-102. doi: 10.1128/AEM.00828-15. Epub 2015 May 22. Appl Environ Microbiol. 2015. PMID: 26002892 Free PMC article.
-
Mapping the Evolution of Hypervirulent Klebsiella pneumoniae.mBio. 2015 Jul 21;6(4):e00630. doi: 10.1128/mBio.00630-15. mBio. 2015. PMID: 26199326 Free PMC article.
-
Type 1 and type 2 strains of Mycoplasma pneumoniae form different biofilms.Microbiology (Reading). 2013 Apr;159(Pt 4):737-747. doi: 10.1099/mic.0.064782-0. Epub 2013 Feb 14. Microbiology (Reading). 2013. PMID: 23412845 Free PMC article.
-
Characterization of the complete mitochondrial genome of Miamiensis avidus causing flatfish scuticociliatosis.Genetica. 2022 Dec;150(6):407-420. doi: 10.1007/s10709-022-00167-5. Epub 2022 Oct 21. Genetica. 2022. PMID: 36269500
References
-
- Kumar S, Filipski A. Multiple sequence alignment: In pursuit of homologous DNA positions. Genome Res. 2007;17:127–135. - PubMed
-
- Lunter G. Probabilistic whole-genome alignments reveal high indel rates in the human and mouse genomes. Bioinformatics. 2007;23 - PubMed
-
- Dewey CN, Pachter L. Evolution at the nucleotide level: the problem of multiple whole-genome alignment. Hum Mol Genet. 2006;15(Suppl 1) - PubMed
-
- Fitch WM. Homology: a personal view on some of the problems. Trends Genet. 2000;16:227–231. - PubMed
Publication types
MeSH terms
Grants and funding
LinkOut - more resources
Full Text Sources
Other Literature Sources

