. 2010 Oct 22;285(43):33381-33393.
doi: 10.1074/jbc.M110.147215. Epub 2010 Jun 30.

Pax6 controls the expression of critical genes involved in pancreatic {alpha} cell differentiation and function

Affiliations

Pax6 controls the expression of critical genes involved in pancreatic {alpha} cell differentiation and function

Yvan Gosmain et al. J Biol Chem. .

Abstract

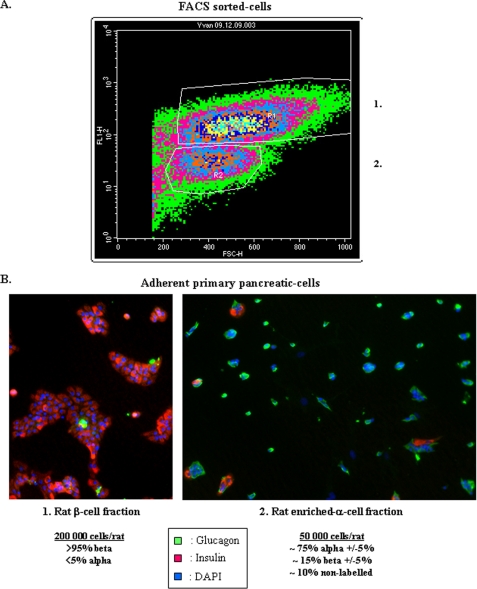
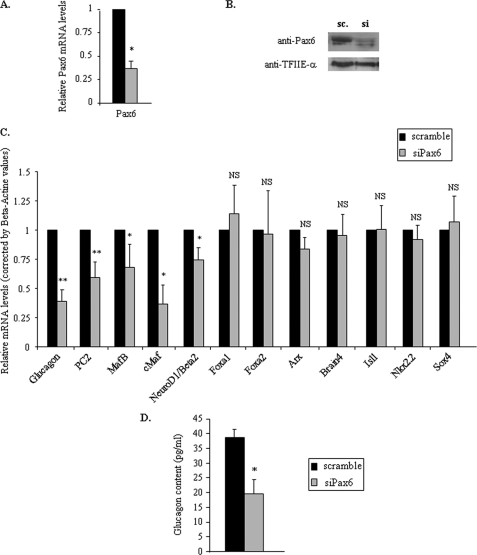
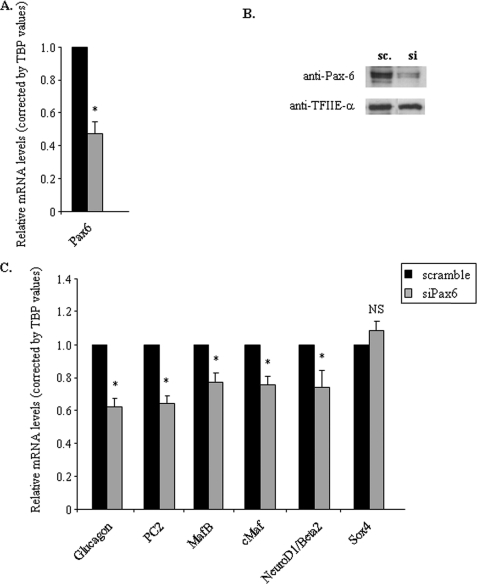
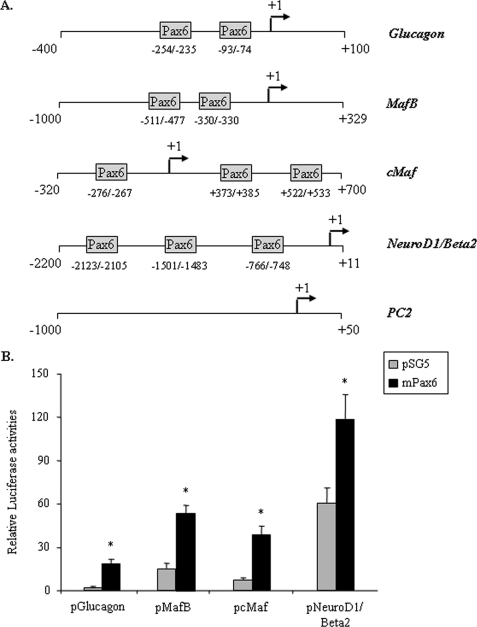
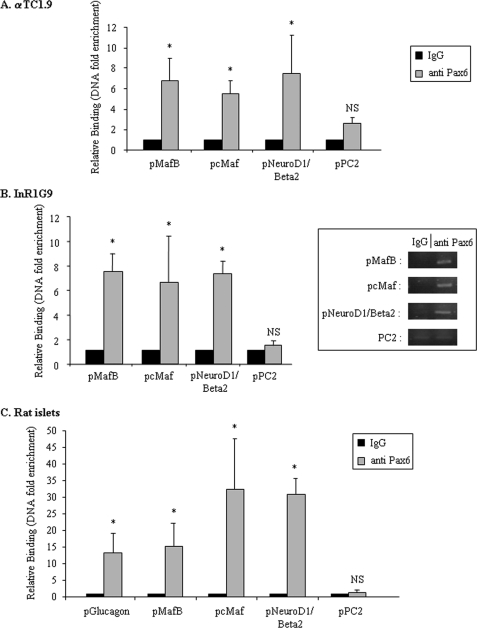
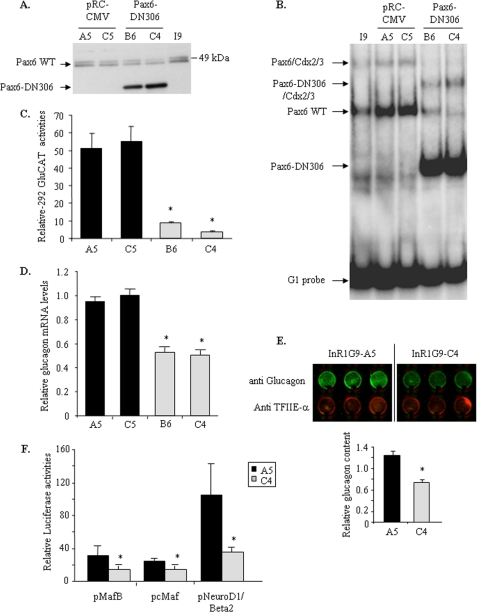
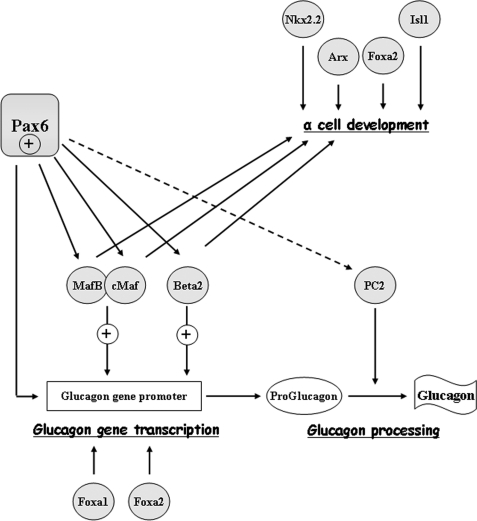
The paired box homeodomain Pax6 is crucial for endocrine cell development and function and plays an essential role in glucose homeostasis. Indeed, mutations of Pax6 are associated with diabetic phenotype. Importantly, homozygous mutant mice for Pax6 are characterized by markedly decreased β and δ cells and absent α cells. To better understand the critical role that Pax6 exerts in glucagon-producing cells, we developed a model of primary rat α cells. To study the transcriptional network of Pax6 in adult and differentiated α cells, we generated Pax6-deficient primary rat α cells and glucagon-producing cells, using either specific siRNA or cells expressing constitutively a dominant-negative form of Pax6. In primary rat α cells, we confirm that Pax6 controls the transcription of the Proglucagon and processing enzyme PC2 genes and identify three new target genes coding for MafB, cMaf, and NeuroD1/Beta2, which are all critical for Glucagon gene transcription and α cell differentiation. Furthermore, we demonstrate that Pax6 directly binds and activates the promoter region of the three genes through specific binding sites and that constitutive expression of a dominant-negative form of Pax6 in glucagon-producing cells (InR1G9) inhibits the activities of the promoters. Finally our results suggest that the critical role of Pax6 action on α cell differentiation is independent of those of Arx and Foxa2, two transcription factors that are necessary for α cell development. We conclude that Pax6 is critical for α cell function and differentiation through the transcriptional control of key genes involved in glucagon gene transcription, proglucagon processing, and α cell differentiation.


Figures

FIGURE 1.
FIGURE 1.
Characterization of primary islet α cells. A, primary rat β cells are separated from non-β cells by autofluorescence-activated cell sorting using a FACStar Plus cell sorter (BD Bioscience). Two major populations were obtained, fractions 1 and 2, which correspond to β cells and non-β cells (enriched α cells). B, characterization of FACS-sorted cells by immunohistochemistry. Endocrine cells fixed with 4% paraformaldehyde were treated with 0.1% Triton X-100 and immunolabeled using polyclonal rabbit glucagon antibody (number AB932, Chemicon International) combined with monoclonal mouse insulin (number I2018, Sigma) antibodies. We also use DAPI to count total cells. Fraction 1 is composed almost exclusively of insulin positive cell (>95%) and fraction 2 is composed by a majority of glucagon-positive cells (∼75% ± 5%).
FIGURE 2.
FIGURE 2.
Effects of specific inhibition of Pax6 gene expression by siRNA in primary rat α cells. Enriched primary rat α cells were transfected with 100 nm of the Pax6 siRNA mixture (siPax6–614 and siPax6–1007) or corresponding scramble during 96 h. A, effects of Pax6 siRNA on Pax6 gene expression by real time RT-PCR. Data are corrected by β-actin mRNA values. B, Western blot analyses of Pax6 protein content from transfected enriched primary rat α cells with scramble or specific Pax6 siRNAs after 96 h. TFIIE-α serves as a control for the specificity of siRNA effects. C, quantitative analyses of the expression of key pancreatic endocrine genes coding for glucagon and transcription factors involved in α cell differentiation or glucagon gene expression 96 h after scramble (sc) or Pax6 siRNA (si) transfection. Data are expressed relative to β-actin mRNA values and are presented as the mean ± S.E. for at least six different experiments. D, glucagon content after specific Pax6 gene silencing. Histograms represent glucagon content in rat primary enriched α cells 96 h after scramble or Pax6 siRNA transfection. Glucagon contents are corrected by total protein amounts. Data are presented as the mean ± S.D. (error bars) for at least two different experiments. * indicates statistical significance with p < 0.05 value using a Student's t test and NS indicates no significant effect.
FIGURE 3.
FIGURE 3.
Effects of specific inhibition of the Pax6 gene by siRNA in αTC1.9 cells. Cells were transfected with 100 nm Pax6 siRNA (si) mixture (siPax6–614 and siPax6–1007) or scramble (sc) siRNA during 96 h. A, effects of Pax6 siRNA on Pax6 gene expression by real time RT-PCR. Data are corrected by TBP mRNA values. B, Western blot analyses of Pax6 protein content from transfected αTC1.9 cells with scramble or specific Pax6 siRNA after 96 h. TFIIE-α serves as a control for the specificity of siRNA effects. C, quantitative analyses of the expression of key pancreatic endocrine genes coding for glucagon and transcription factors involved in α cell differentiation or glucagon gene expression 96 h after scramble or Pax6 siRNA transfection. Only the regulated mRNA levels and a control mRNA (Sox4) are shown. Data are expressed relative to TBP mRNA values and are presented as the mean ± S.D. (error bars) for at least three different experiments. * indicates statistical significance with p < 0.05 value using a Student's t test and NS indicates no significant effect.
FIGURE 4.
FIGURE 4.
Pax6 target gene promoter structure and effects of Pax6 overexpression on transcription in BHK-21 cells. A, schematic representation of the rat Glucagon and cMaf and mouse MafB, NeuroD1/Beta2, and PC2 gene promoters. Putative Pax6 binding sites are represented by boxes. B, the Glucagon, MafB, cMaf, and NeuroD1/Beta2 gene promoters were cotransfected in BHK-21 cells with pSG5 (gray bars) or mouse Pax6 cDNA (mPax6, black bars). Histograms represent normalized LUC activities of promoter constructs versus corresponding promoter-less LUC reporter genes 48 h after transfection. Data are presented as the mean ± S.D. (error bars) for three different transfection experiments. * indicates statistical significance with p < 0.05 using Student's t test and NS indicates no significant effect.
FIGURE 5.
FIGURE 5.
Analyses of Pax6 binding on the MafB, cMaf, and NeuroD1/Beta2 gene promoters by electrophoretic mobility shift assays experiments. Representative gels for Pax6 binding on MafB, cMaf, and NeuroD1/Beta2 gene promoters. EMSA were performed with 5′ end-labeled MafB (−357/−322bp), cMaf (+362/+396 and +511/+545 bp), and NeuroD1/Beta2 (−2133/−2096, −1510/−1471, and −775/−741 bp) oligonucleotides (listed in supplemental Table S2) in the presence of 10 μg of nuclear extracts from BHK-21 cells (pSG5, negative control) or BHK-21 cells overexpressing mouse Pax6 (p46). An anti-Pax6 antibody was used to test the specificity of Pax6 binding as well as native and mutated cold probes in 200-fold excess. Arrows indicate specific shifts and supershifts for Pax6 proteins on probes. EMSA experiments were performed at least three times for each probe.
FIGURE 6.
FIGURE 6.
In vivo interactions of Pax6 on the MafB, cMaf, NeuroD1/Beta2, and PC2 gene promoters. Quantitative ChIP analyses in glucagon-producing cell lines (A, αTC1.9 and B, InR1G9) and rat islet cells (C). Histograms represent relative binding of Pax6 on the Glucagon (pGlucagon), MafB (pMafB), cMaf (pcMaf), NeuroD1/Beta2 (pNeuroD1/pBeta2), and PC2 (pPC2) gene promoters in different cell lines or islets. After cross-linking between chromatin and the interacting proteins, specific immunoprecipitations with anti-Pax6 antibody were performed as indicated under “Experimental Procedures.” Binding was analyzed by real time PCR with a Light-Cycler (Roche Diagnostics). Binding intensity data are expressed relative to IgG immunoprecipitation (nonspecific binding) and presented as the mean ± S.D. (error bars) for at least three independent experiments for cell lines and two independent experiments for rat islets cells. An anti-Histone H4 immunoprecipitation was also performed as a positive control for each promoter (data not shown). * indicates statistical significance with p < 0.05 value using a Student's t test and NS indicates no significant effect. Qualitative aspects of quantitative PCR are also presented in-frame with representative signals for IgG and anti-Pax6 interactions to target gene promoters in InR1G9 cells.
FIGURE 7.
FIGURE 7.
Characterization of Pax6-DN306 InR1G9 stable clones. A, Pax6-DN306 expression in InR1G9 stable clones. Western blot analyses of nuclear extracts from native InR1G9, A5-C5 clones (pRC-CMV), and B6-C4 clones (Pax6-DN306). Wild-type Pax6 is visualized by two specific bands at around 49 kDa (corresponding to p46 and p48 isoforms) and Pax6-DN306 at ∼39 kDa. B, analyses of Pax6-DN306 binding to the G1 element of the rat glucagon gene promoter by EMSA experiments. 32P-Labeled G1 was incubated with native InR1G9 nuclear extract as well as nuclear extracts from A5-C5 and B6-C4 clones. Arrows indicate specific binding to the G1 element. C, analyses of −292 bp glucagon gene promoter activities in Pax6-DN306- and empty vector-InR1G9 clones. InR1G9-stable clones were transfected with the rat glucagon promoter (−292GluCAT) for 48 h. Data are expressed relative to the empty CAT reporter gene and presented as mean ± S.D. (error bars) for three different transfection experiments. D, quantitative analyses of glucagon mRNA levels in InR1G9-stable clones. Results were corrected by β-actin mRNA levels and are presented as the mean ± S.D. (error bars) for at least three independent experiments. * indicates statistical significance with p < 0.05 value using a Student's t test and NS indicates no significant effect. E, analyses of glucagon content in InR1G9-stable clones by the “In-cell Western blot” technique (described under “Experimental Procedures”). F, the rat cMaf and mouse MafB and NeuroD1/Beta2 gene promoters were transfected in InR1G9-stable clones. Histograms represent normalized LUC activities of promoter constructs versus corresponding promoter-less LUC reporter genes 48 h after transfection. Promoter activities were analyzed in A5 (black bars) and C4 (gray bars) InR1G9-stable clones after 48 h of transfection. Data are presented as the mean ± S.E. for three different transfection experiments. * indicates statistical significance with p < 0.05 using Student's t test and NS indicates no significant effect.
FIGURE 8.
FIGURE 8.
Effects of Pax6 binding site mutations on MafB, cMaf, and NeuroD1/Beta2 gene promoters. The rat cMaf and mouse MafB, NeuroD1/Beta2 gene promoters, and corresponding mutated promoter constructs were transfected in αTC1.9 cells. A, histograms represent normalized LUC activities of promoter constructs 48 h after transfection. Data are presented as the mean ± S.D. (error bars) for three different transfection experiments. * indicates statistical significance with p < 0.05 value using Student's t test and NS indicates no significant effect. B, schematic representation of MafB, cMaf, and NeuroD1/Beta2 gene promoters. Only Pax6 binding sites characterized by EMSA experiments are represented. Functional binding sites are represented by an oval sphere.
FIGURE 9.
FIGURE 9.
Schematic representation of Pax6 effects on α cell development and glucagon biosynthesis. Pax6 involvement on α cell differentiation, glucagon gene transcription, and processing is represented by black arrows for direct and the dotted arrow for indirect Pax6 effects.

Similar articles

Cited by

References

    1. Dunning B. E., Gerich J. E. (2007) Endocr. Rev. 28, 253–283 - PubMed
    1. Sander M., Neubüser A., Kalamaras J., Ee H. C., Martin G. R., German M. S. (1997) Genes Dev. 11, 1662–1673 - PubMed
    1. St-Onge L., Sosa-Pineda B., Chowdhury K., Mansouri A., Gruss P. (1997) Nature 387, 406–409 - PubMed
    1. Collombat P., Mansouri A., Hecksher-Sorensen J., Serup P., Krull J., Gradwohl G., Gruss P. (2003) Genes Dev. 17, 2591–2603 - PMC - PubMed
    1. Lee C. S., Sund N. J., Behr R., Herrera P. L., Kaestner K. H. (2005) Dev. Biol. 278, 484–495 - PubMed

Publication types

MeSH terms