

Socioeconomic inequalities in cancer survival in England after the NHS cancer plan
- PMID: 20588275
- PMCID: PMC2939774
- DOI: 10.1038/sj.bjc.6605752
Socioeconomic inequalities in cancer survival in England after the NHS cancer plan
Abstract
Background: Socioeconomic inequalities in survival were observed for many cancers in England during 1981-1999. The NHS Cancer Plan (2000) aimed to improve survival and reduce these inequalities. This study examines trends in the deprivation gap in cancer survival after implementation of the Plan.
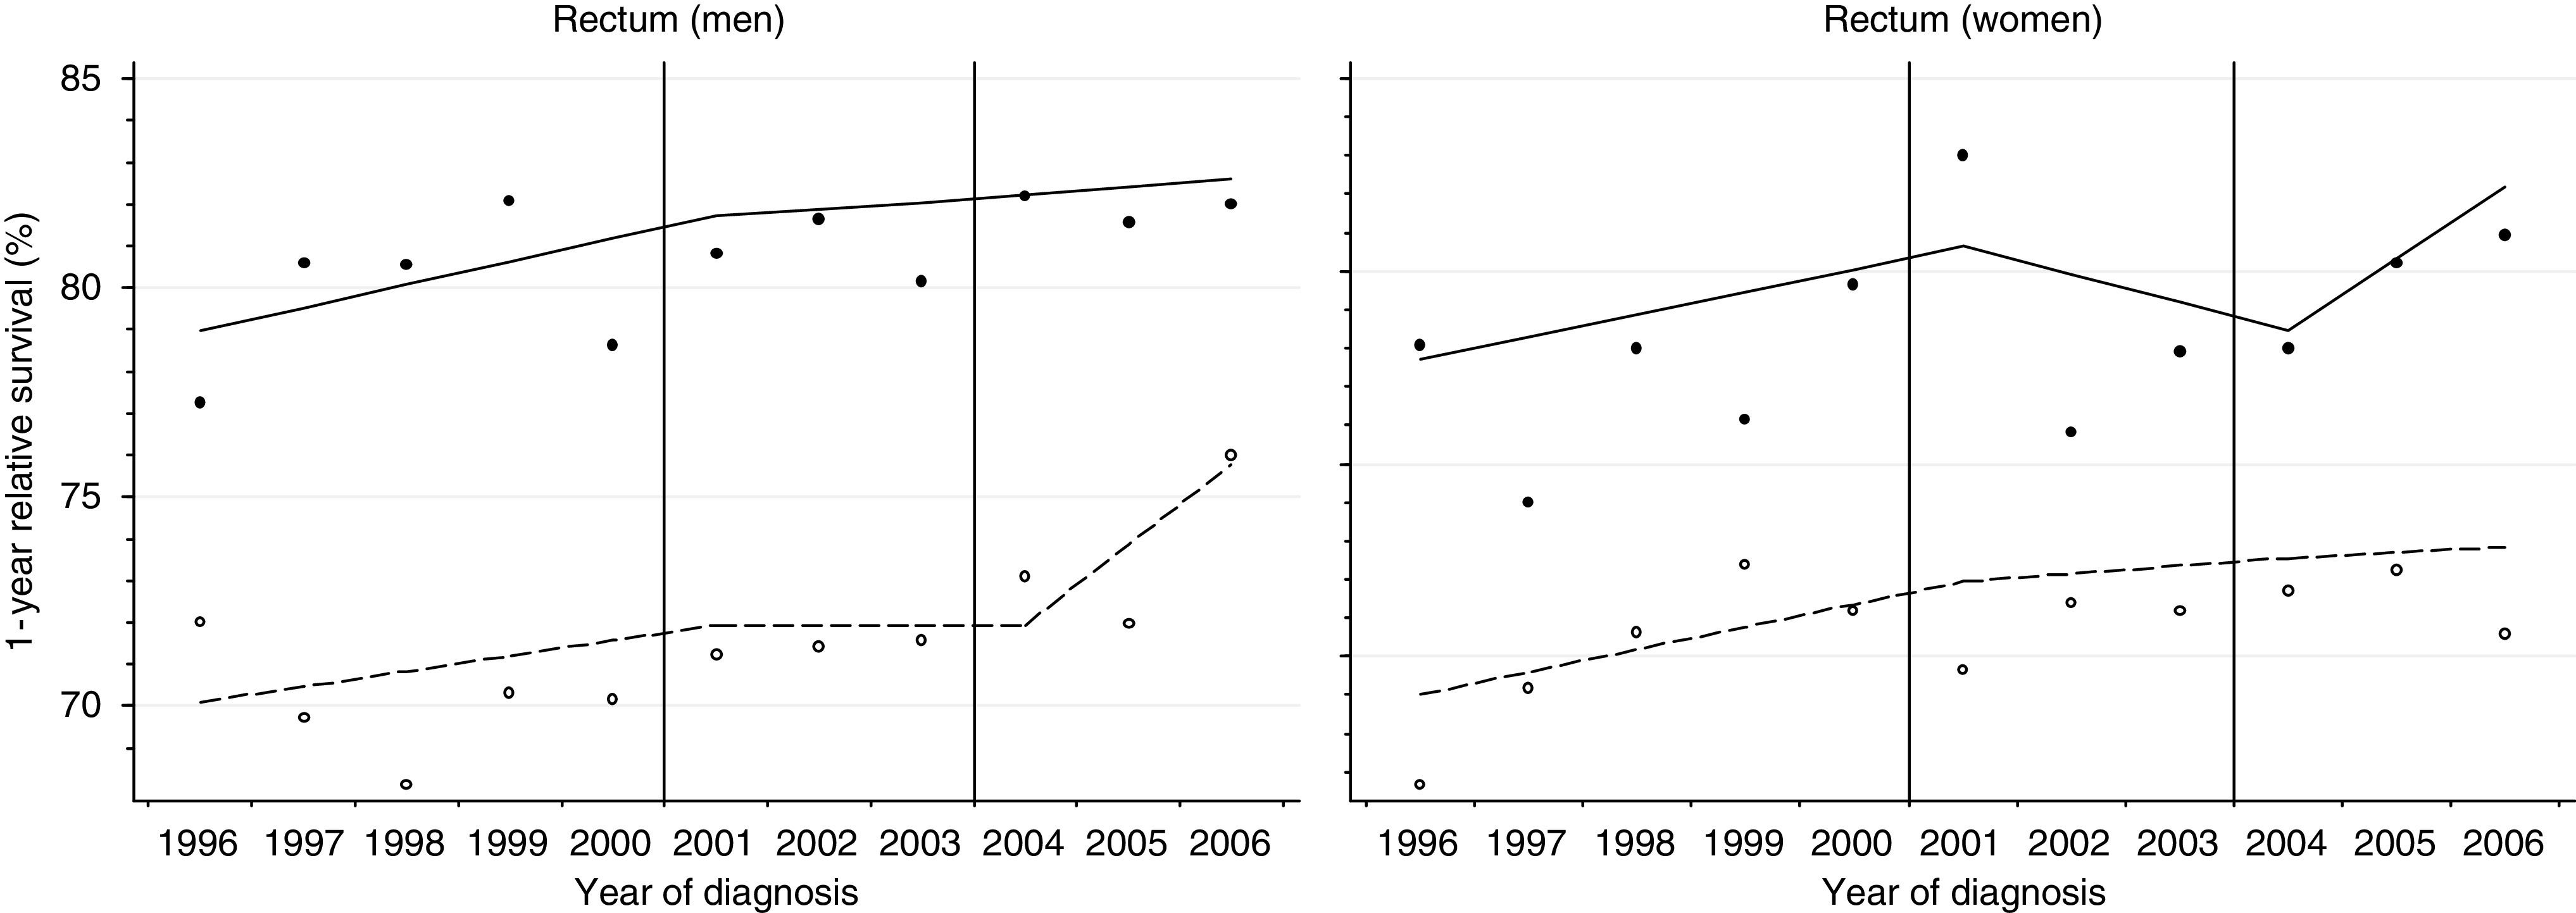
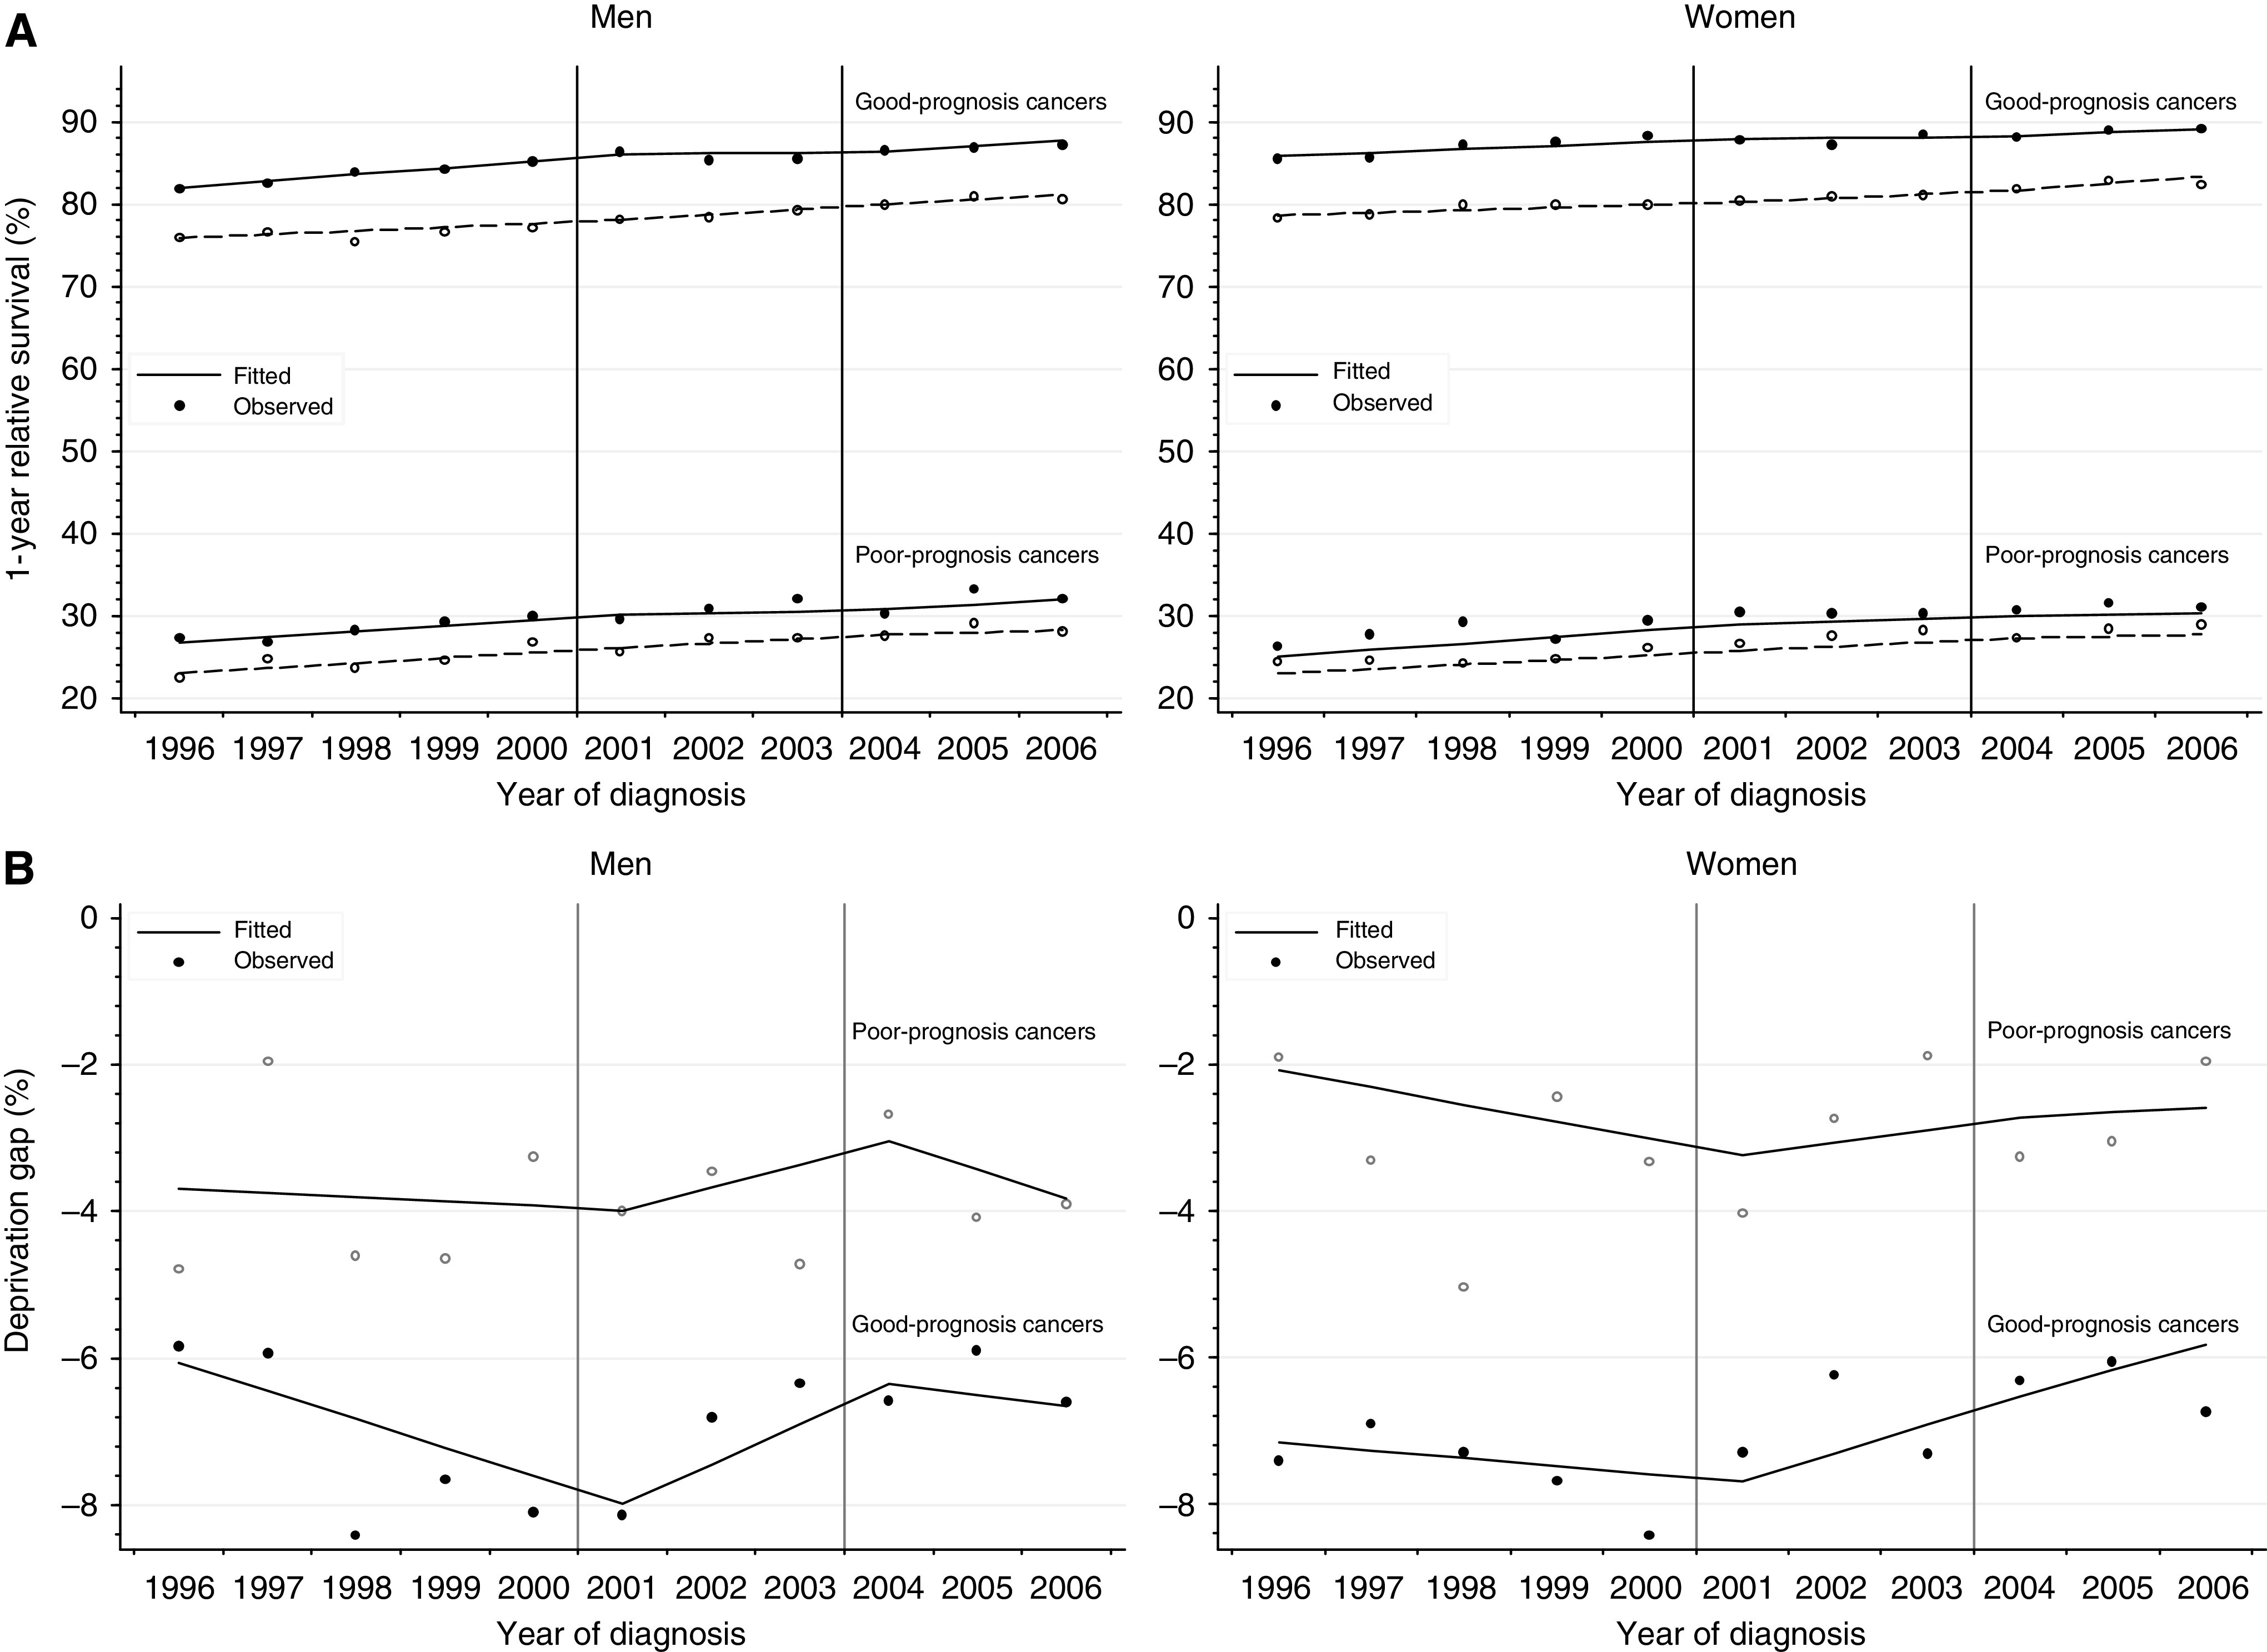
Materials and method: We examined relative survival among adults diagnosed with 1 of 21 common cancers in England during 1996-2006, followed up to 31 December 2007. Three periods were defined: 1996-2000 (before the Cancer Plan), 2001-2003 (initialisation) and 2004-2006 (implementation). We estimated the difference in survival between the most deprived and most affluent groups (deprivation gap) at 1 and 3 years after diagnosis, and the change in the deprivation gap both within and between these periods.
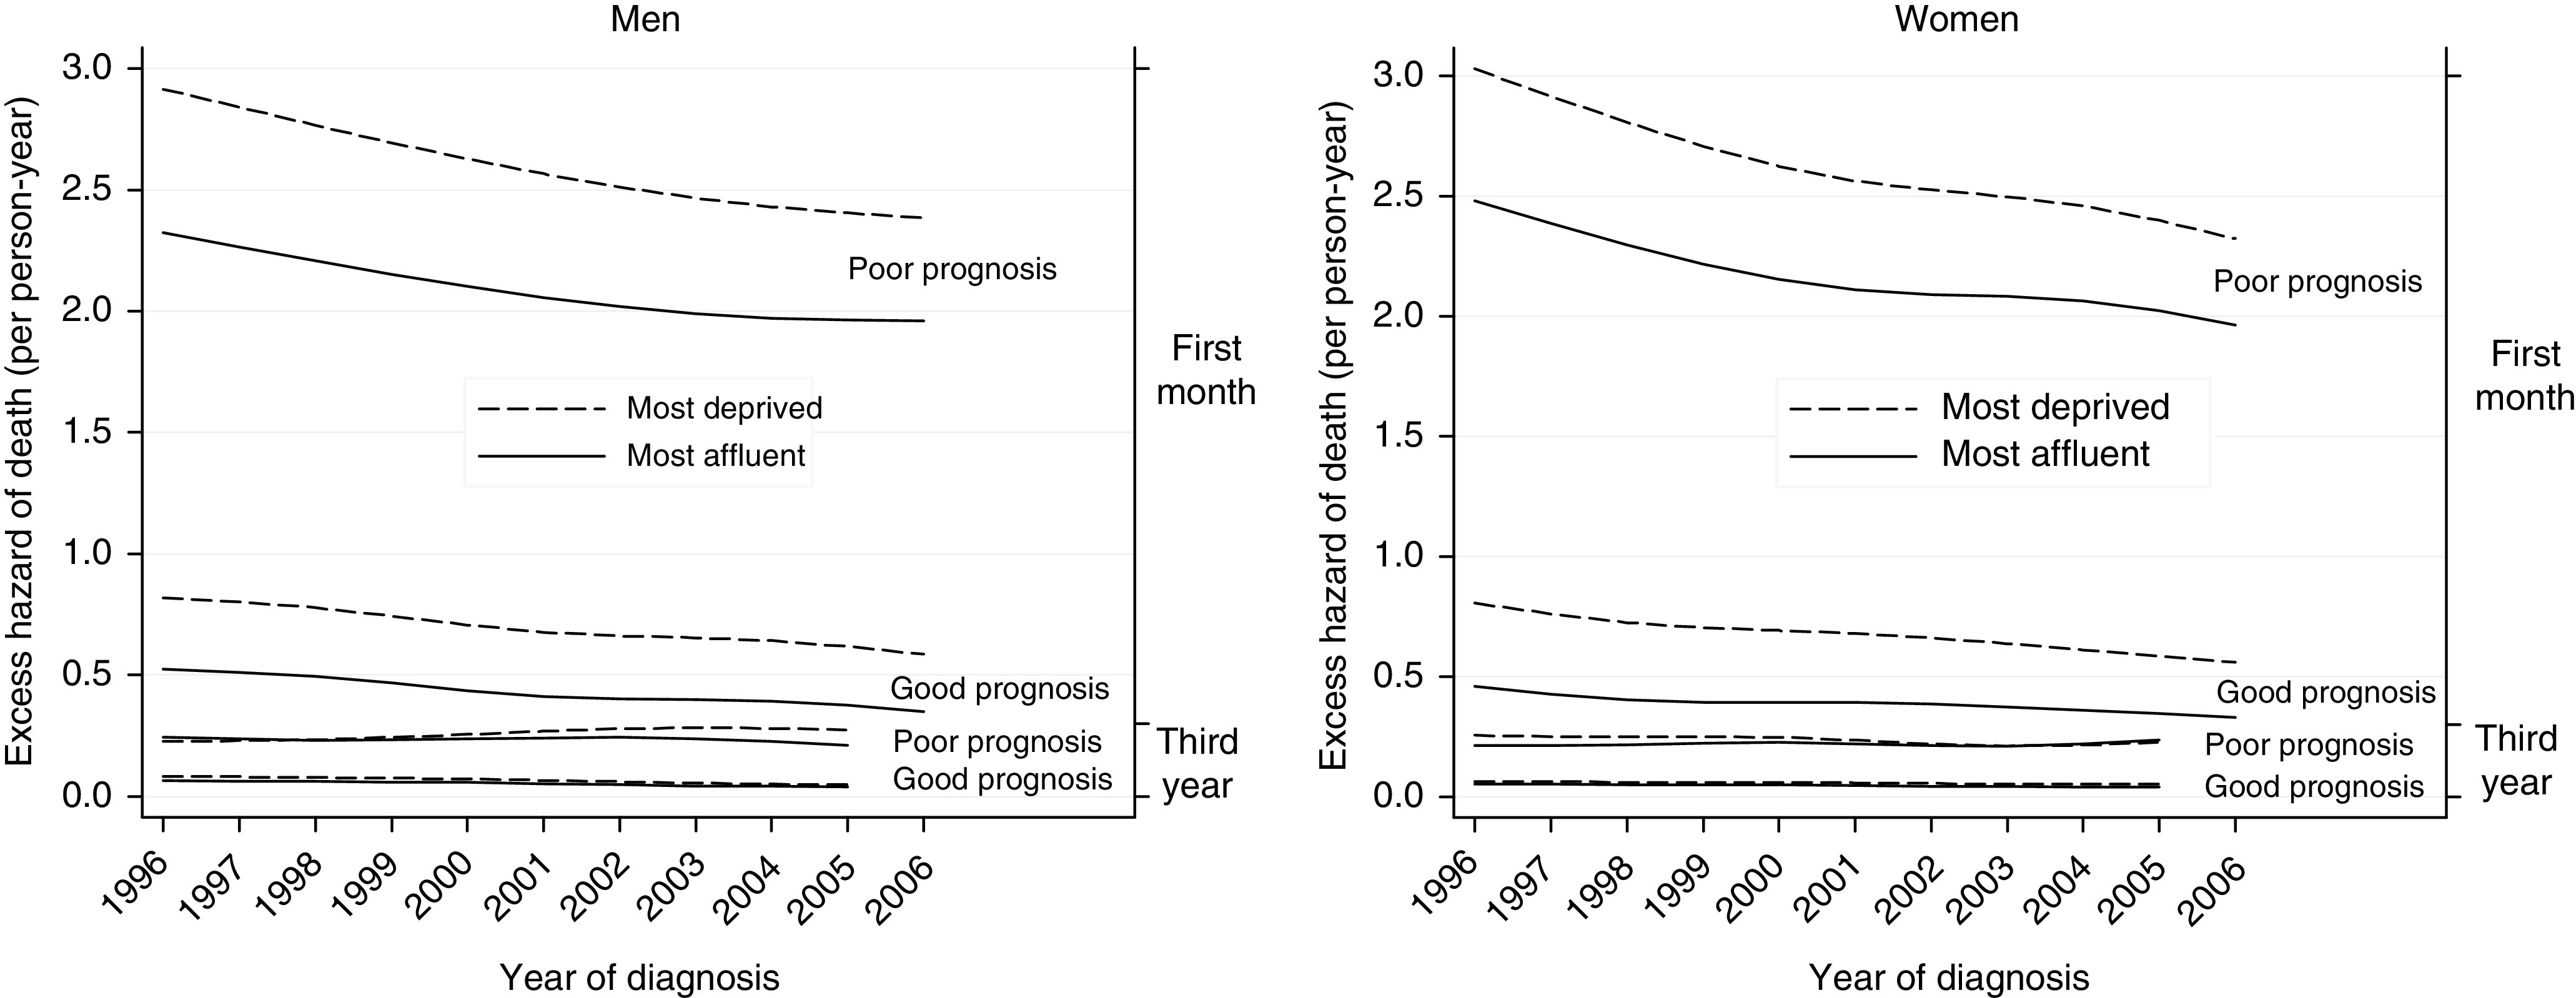
Results: Survival improved for most cancers, but inequalities in survival were still wide for many cancers in 2006. Only the deprivation gap in 1-year survival narrowed slightly over time. A majority of the socioeconomic disparities in survival occurred soon after a cancer diagnosis, regardless of the cancer prognosis.
Conclusion: The recently observed reduction in the deprivation gap was minor and limited to 1-year survival, suggesting that, so far, the Cancer Plan has little effect on those inequalities. Our findings highlight that earlier diagnosis and rapid access to optimal treatment should be ensured for all socioeconomic groups.
Figures
Comment in
-
Inequalities in cancer survival and the NHS cancer plan: evidence of progress?Br J Cancer. 2010 Aug 10;103(4):437-8. doi: 10.1038/sj.bjc.6605830. Br J Cancer. 2010. PMID: 20697413 Free PMC article. No abstract available.
Similar articles
-
Impact of national cancer policies on cancer survival trends and socioeconomic inequalities in England, 1996-2013: population based study.BMJ. 2018 Mar 14;360:k764. doi: 10.1136/bmj.k764. BMJ. 2018. PMID: 29540358 Free PMC article.
-
The impact of age at diagnosis on socioeconomic inequalities in adult cancer survival in England.Cancer Epidemiol. 2015 Aug;39(4):641-9. doi: 10.1016/j.canep.2015.05.006. Epub 2015 Jul 2. Cancer Epidemiol. 2015. PMID: 26143284 Free PMC article.
-
Trends and socioeconomic inequalities in cancer survival in England and Wales up to 2001.Br J Cancer. 2004 Apr 5;90(7):1367-73. doi: 10.1038/sj.bjc.6601696. Br J Cancer. 2004. PMID: 15054456 Free PMC article.
-
Health inequalities are worsening in the North East of England.Br Med Bull. 2020 Jul 9;134(1):63-72. doi: 10.1093/bmb/ldaa008. Br Med Bull. 2020. PMID: 32462181 Free PMC article. Review.
-
[Socioeconomic Inequalities in Cancer Outcome in Japan].Gan To Kagaku Ryoho. 2020 Jul;47(7):1007-1011. Gan To Kagaku Ryoho. 2020. PMID: 32668840 Review. Japanese.
Cited by
-
Inequalities in cancer survival and the NHS cancer plan: evidence of progress?Br J Cancer. 2010 Aug 10;103(4):437-8. doi: 10.1038/sj.bjc.6605830. Br J Cancer. 2010. PMID: 20697413 Free PMC article. No abstract available.
-
An investigation of cancer survival inequalities associated with individual-level socio-economic status, area-level deprivation, and contextual effects, in a cancer patient cohort in England and Wales.BMC Public Health. 2022 Jan 13;22(1):90. doi: 10.1186/s12889-022-12525-1. BMC Public Health. 2022. PMID: 35027042 Free PMC article.
-
Feasibility and acceptability of a cancer symptom awareness intervention for adults living in socioeconomically deprived communities.BMC Public Health. 2018 Jun 5;18(1):695. doi: 10.1186/s12889-018-5606-3. BMC Public Health. 2018. PMID: 29871618 Free PMC article.
-
Global surveillance of cancer survival 1995-2009: analysis of individual data for 25,676,887 patients from 279 population-based registries in 67 countries (CONCORD-2).Lancet. 2015 Mar 14;385(9972):977-1010. doi: 10.1016/S0140-6736(14)62038-9. Epub 2014 Nov 26. Lancet. 2015. PMID: 25467588 Free PMC article.
-
Do pre-diagnosis primary care consultation patterns explain deprivation-specific differences in net survival among women with breast cancer? An examination of individually-linked data from the UK West Midlands cancer registry, national screening programme and Clinical Practice Research Datalink.BMC Cancer. 2017 Feb 23;17(1):155. doi: 10.1186/s12885-017-3129-4. BMC Cancer. 2017. PMID: 28231774 Free PMC article.
References
-
- Anon (2009) The National Awareness and Early Diagnosis Initiative (NAEDI). Department of Health. http://info.cancerresearchuk.org/publicpolicy/naedi/ Accessed 16 Jun 2009
-
- Berrino F, De Angelis R, Sant M, Rosso S, Lasota MB, Coebergh JWW, Santaquilani M, EUROCARE Working Group (2007) Survival for eight major cancers and all cancers combined for European adults diagnosed in 1995–99: results of the EUROCARE-4 study. Lancet Oncol 8: 773–783 - PubMed
-
- Brenner H, Rachet B (2004) Hybrid analysis for up-to-date long-term survival rates in cancer registries with delayed recording of incident cases. Eur J Cancer 40: 2494–2501 - PubMed
-
- Cancer Research UK Cancer Survival Group (2004) Life tables for England and Wales by sex, calendar period, region and deprivation. http://www.lshtm.ac.uk/ncdeu/cancersurvival/tools/ London School of Hygiene & Tropical Medicine, accessed 16 Feb 2009
Publication types
MeSH terms
Grants and funding
LinkOut - more resources
Full Text Sources
Other Literature Sources
Medical
Miscellaneous
