. 2010 Oct 14;116(15):2732-41.
doi: 10.1182/blood-2009-11-256354. Epub 2010 Jun 21.

Overcoming resistance to histone deacetylase inhibitors in human leukemia with the redox modulating compound β-phenylethyl isothiocyanate

Affiliations

Overcoming resistance to histone deacetylase inhibitors in human leukemia with the redox modulating compound β-phenylethyl isothiocyanate

Yumin Hu et al. Blood. .

Abstract

Mechanisms of action and resistance of histone deacetylase inhibitors (HDACIs) are not well understood. A gene expression analysis performed in a phase 1 trial of vorinostat in leukemia indicated that overexpression of genes involved in antioxidant defense was associated with clinical resistance. We hypothesized that nonepigenetic mechanisms may be involved in resistance to HDACI therapy in leukemia. Here we confirmed up-regulation of a series of antioxidants in a pan-HDACI-resistant leukemia cell line HL60/LR. Vorinostat induced reactive oxygen species (ROS) through nicotinamide adenine dinucleotide phosphate oxidase in leukemia cells. An increase in ROS resulted in translocation of nuclear factor E2-related factor 2 from cytosol to nucleus, leading to up-regulation of antioxidant genes, including a majority of glutathione-associated enzymes as a cellular protective mechanism. Addition of β-phenylethyl isothiocyanate, a natural compound capable of depleting cellular glutathione, significantly enhanced the cytotoxicity of vorinostat in leukemia cell lines and primary leukemia cells by inhibiting the cytoprotective antioxidant response. These results suggest that ROS plays an important role in action of vorinostat and that combination with a redox-modulating compound increases sensitivity to HDACIs and also overcomes vorinostat resistance. Such a combination strategy may be an effective therapeutic regimen and have potential clinical application in leukemia.


Figures

Figure 1
Figure 1
Significant increase of a series of antioxidants in HL60/LR cells compared with parental HL60. (A) Comparison of mRNA expression of antioxidant genes in HL60 and HL60/LR cells by real-time PCR analysis. Numbers indicate fold increase in HL60/LR cells. Bars represent mean ± SD from 3 experiments. GCLC indicates glutamate-cysteine ligase, catalytic subunit; and GCLM, glutamate-cysteine ligase, modifier subunit. (B) Cell lysates of HL60 and HL60/LR were analyzed for the indicated antioxidant protein expression using immunoblot assay. β-Actin was used as loading control. (C) Increase of cellular GSH level in HL60/LR cells. Bars represent mean ± SD from 3 experiments. *P < .01 (Student t test). (D) HL60 cells were treated with 1μM vorinostat (Vor) for 18 hours, and cells were labeled with Het for 1 hour followed by flow cytometric analysis to detect O2 levels. Ctrl indicates control cells without treatment. (E-F) Representative histograms of significant decrease of O2 and H2O2 levels in HL60/LR cells versus HL60 as detected by fluorescent probe Het and DCF-DA, respectively.
Figure 2
Figure 2
Vorinostat induced NOX-derived ROS generation. (A) HL60, U937, and ML1 cells were treated with vorinostat alone (1μM for HL60, 2μM for U937 and ML1), 2μM DPI alone, or vorinostat plus DPI for the indicated time. Cells were then subjected to NOX activity assay as described in “NADPH oxidase activity assay.” DPI completely blocked the up-regulation of NOX activity induced by vorinostat. Bars represent mean ± SD from 3 experiments. (B) Histogram overlay of baseline O2 levels in HL60 and HL60/C6F. (C-D) Representative histogram overlay of O2 levels in HL60 and HL60/C6F before and after treatment of 1μM vorinostat for 18 hours. Numbers in panels B through D indicate mean values of O2 levels detected by Het. Vor indicates vorinostat.
Figure 3
Figure 3
Effect of vorinostat on Nrf2-regulated antioxidant genes. (A) Up-regulation of mRNA expression of various antioxidants after vorinostat treatment. U937 cells were treated with 2μM vorinostat for 20 hours and mRNA expression of the indicated genes before and after treatment were compared by real-time PCR analysis. Numbers indicate fold change in treated cells compared with untreated cells. Bars represent mean ± SD from 3 experiments. (B) Vorinostat induced translocation of Nrf2 from cytosol to nucleus. U937 cells were treated with 2μM vorinostat for 18 hours and then cytospun. Cells were fixed and labeled for Nrf2 protein (red) and nucleus (blue, 4,6-diamidino-2-phenylindole) as described in “Immunofluorescence and confocal microscopy.” Images were taken by Nikon Eclipse TE2000 confocal microscope with 40×/1.30 numeric aperture oil objective lens. Ctrl indicates control cells without treatment; and Vor, vorinostat. (C) HEK293 cells were transfected with empty vector only or vector with Nrf2 cDNA. Overexpression of Nrf2 and increase of GCLC were verified by Western blot analysis 40 hours after transfection. (D) Nrf2 prevented ROS induced by vorinostat. Cellular H2O2 levels before and after 5μM vorinostat incubation for another 24 hours in HEK293 cells transfected with empty vector or Nrf2 were detected by flow cytometric analysis. Vor indicates vorinostat. Numbers indicate mean values of H2O2 levels.
Figure 4
Figure 4
Combination of vorinostat and PEITC induced ROS-mediated apoptosis. (A) Illustration of biochemical strategy to enhance cellular ROS accumulation. Vorinostat induced NOX-derived O2, which is further converted to H2O2. PEITC was used to inhibit H2O2 elimination by GSH system and thus caused further ROS stress. (B) Treatment with 2μM vorinostat and 2.5μM PEITC for 18 hours caused significant increase of O2 and H2O2 in U937 cells, respectively, as detected by fluorescent probes Het and DCF-DA. (C) Quantitative analysis of H2O2 accumulation induced by 2μM vorinostat alone (Vor), 2.5μM PEITC alone, and vorinostat plus PEITC (V + P). Bars represent mean ± SD from 3 experiments. (D) Change of mitochondrial transmembrane potential in U937 cells treated with the indicated compounds was detected by flow cytometry using rhodamine-123. Numbers indicate percentage of cells with loss of transmembrane potential. Pretreatment with 5mM NAC 1 hour before coadministration of vorinostat and PEITC completely blocked the loss of transmembrane potential induced by such combination. (E) Apoptosis induced by the indicated compounds and protection of cell death by pretreatment with 5mM NAC 1 hour before was detected by double staining of annexin V/PI. Numbers indicate percentage of cell death population. (F-G) Incubation with 2μM vorinostat for 18 hours followed by 5μM PEITC for another 2 hours (V18h/P2h) also induced significant increase of H2O2 in U937 cells and subsequent decrease of mitochondrial transmembrane potential (V18h/P3h, vorinostat for 18 hours followed by PEITC for 3 hours). Pretreatment with 5mM NAC 1 hour before inhibited both increase of H2O2 and loss of mitochondrial transmembrane potential (+NAC). (H) Incubation with 2μM vorinostat for 18 hours followed by 5μM PEITC for 6 hours resulted in tremendous apoptosis as demonstrated by annexin V/PI assay. Pretreatment with 5mM NAC significantly prevented the cell death induced by the combination treatment. Numbers indicate percentage of apoptotic cell death population.
Figure 5
Figure 5
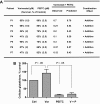
Synergistic activity between vorinostat and PEITC in various myeloid leukemia cell lines. (A) Dose-dependent induction of apoptosis in U937 by vorinostat in the absence and presence of PEITC (2.5μM, 48 hours) was analyzed with annexin V/PI assay. Data represent mean ± SD from 3 experiments. Addition of 2.5μM PEITC significantly enhanced the cytotoxicity of vorinostat alone. *P < .01 (Student t test). (B) Combination index (CI) of vorinostat and PEITC in U937 cells were analyzed by median dose-effect method using Calcusyn Version 2.0 software (Biosoft). U937 cells were incubated with various concentrations of vorinostat (0.3-4μM) and PEITC (0.5-3μM) for 72 hours. Drug effect on cell viability was determined by MTT assay as described in “Cytotoxicity assays.” CI = 1 indicates additive effect; CI < 1 indicates synergistic effect; and CI > 1 indicates antagonist effect. (C) HL60 cells were treated with 1μM vorinostat alone, 1μM PEITC alone, or vorinostat plus PEITC (V + P) for 48 hours, and killing effect was analyzed with annexin V/PI assay. Bars represent mean ± SD from 3 experiments. (D) Growth inhibition by vorinostat and PEITC in U937 and ML1 cells. Cells in exponential growth were treated with vorinostat or/and PEITC at the indicated concentration. Cell culture was continued for up to 72 hours, and total cell numbers were counted every 24 hours using a Coulter Z2 Particle Counter & Size Analyzer. (E) Sequence-dependent effect of vorinostat combined with PEITC in U937 and ML1 cells. U937 and ML1 cells were both treated with 2μM vorinostat and 2.5μM PEITC concomitantly for 48 hours (V + P) or treated with vorinostat for 24 hours followed by PEITC for another 24 hours (V/P), or treated with PEITC for 24 hours followed by vorinostat for another 24 hours (P/V). Cytotoxic effect of each compound alone or their combination was analyzed with annexin V/PI assay.
Figure 6
Figure 6
Cytotoxicity of vorinostat, PEITC, and their combination in fresh myeloid leukemia cells. (A) Fresh primary leukemia cells isolated from 7 patients with AML were each treated with various concentrations of vorinostat (1μM, 1.5μM, and 2μM) and 2.5μM PEITC alone or their combination for 48 hours. Cell viability was determined by annexin V/PI assay. The expected viable cell fraction (percentage) was calculated by multiplying percentage viable cells in the vorinostat-treated sample with the percentage of viable cells in the PEITC-treated sample. The combination effect is considered additive when the observed viable cell fraction is equal to the expected value. When observed value is less than the expected value, the combination effect is considered more than additive. (B) Total glutathione levels in primary AML cells treated with 2μM vorinostat or/and 2.5μM for 16 hours. Values are normalized to the levels in untreated cells. Bars represent mean ± SD (n = 4 AML patient samples).
Figure 7
Figure 7
Proposed model of combination effect of an HDACI and PEITC on leukemia cells. An HDACI activates NOX and induces ROS stress, which contributes to cellular damage and cytotoxicity. As a secondary response, increase of ROS also results in translocation of Nrf2, a transcription factor, from cytosol to nucleus, leading to up-regulation of its downstream targets, including antioxidants and phase 2 detoxification genes. Among these genes, the effectiveness of GST to detoxify foreign compounds depends on GSH levels, which is determined by GCL, the key enzyme for glutathione synthesis and GSR, the enzyme responsible for glutathione regeneration. GPX relies on glutathione as a substrate to eliminate H2O2. As such, GSH system is critical for cellular defense against oxidative injury. Addition of PEITC, the compound capable of depleting cellular GSH, inhibits such defense system and potentiates the antileukemia activity of HDACIs.

Similar articles

Cited by

References

    1. Xu WS, Parmigiani RB, Marks PA. Histone deacetylase inhibitors: molecular mechanisms of action. Oncogene. 2007;26(37):5541–5552. - PubMed
    1. Carlisi D, Lauricella M, D'Anneo A, et al. The histone deacetylase inhibitor suberoylanilide hydroxamic acid sensitises human hepatocellular carcinoma cells to TRAIL-induced apoptosis by TRAIL-DISC activation. Eur J Cancer. 2009;45(13):2425–2438. - PubMed
    1. Ruefli AA, Ausserlechner MJ, Bernhard D, et al. The histone deacetylase inhibitor and chemotherapeutic agent suberoylanilide hydroxamic acid (SAHA) induces a cell-death pathway characterized by cleavage of Bid and production of reactive oxygen species. Proc Natl Acad Sci U S A. 2001;98(19):10833–10838. - PMC - PubMed
    1. Peart MJ, Tainton KM, Ruefli AA, et al. Novel mechanisms of apoptosis induced by histone deacetylase inhibitors. Cancer Res. 2003;63(15):4460–4471. - PubMed
    1. Nimmanapalli R, Fuino L, Stobaugh C, Richon V, Bhalla K. Cotreatment with the histone deacetylase inhibitor suberoylanilide hydroxamic acid (SAHA) enhances imatinib-induced apoptosis of Bcr-Abl-positive human acute leukemia cells. Blood. 2003;101(8):3236–3239. - PubMed

Publication types

MeSH terms