. 2010 Jun 28;189(7):1157-69.
doi: 10.1083/jcb.200912093. Epub 2010 Jun 21.

Mammalian target of rapamycin regulates miRNA-1 and follistatin in skeletal myogenesis

Affiliations

Mammalian target of rapamycin regulates miRNA-1 and follistatin in skeletal myogenesis

Yuting Sun et al. J Cell Biol. .

Abstract

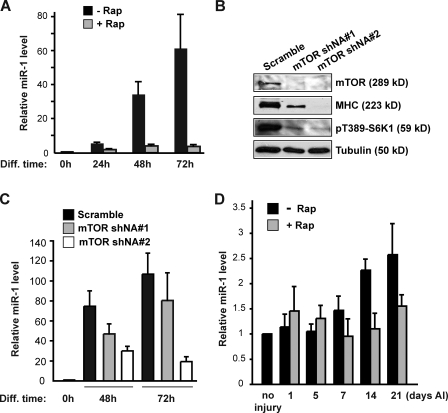
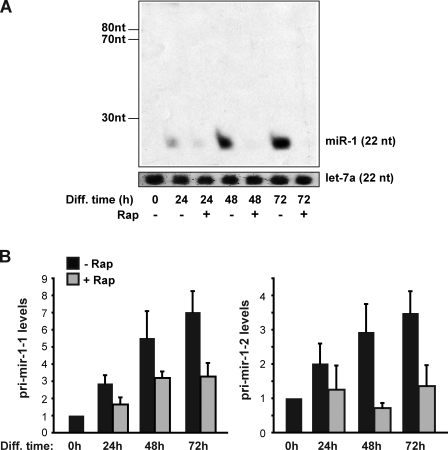
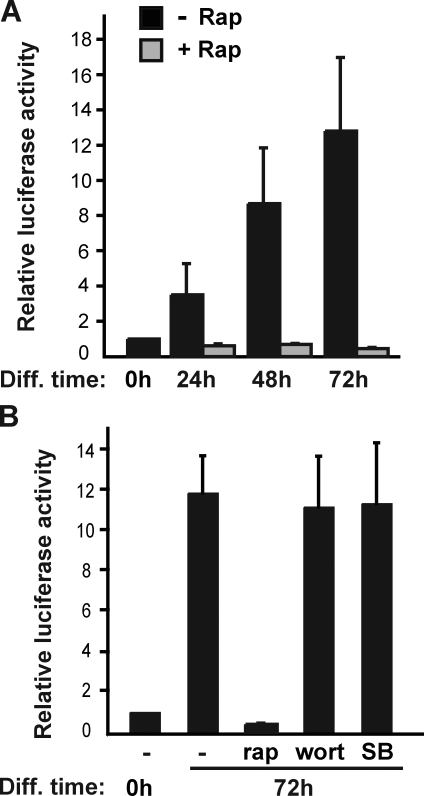
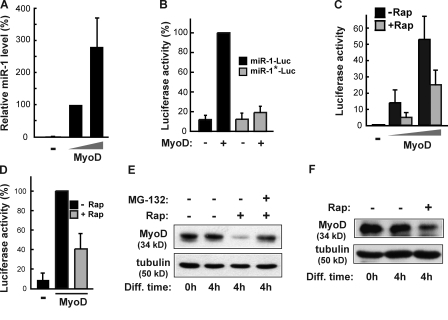
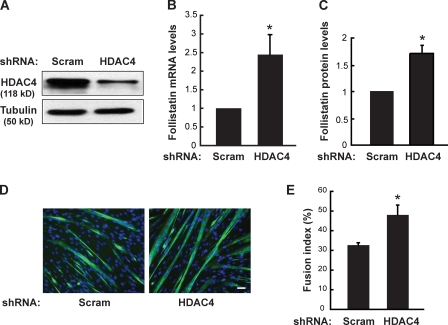
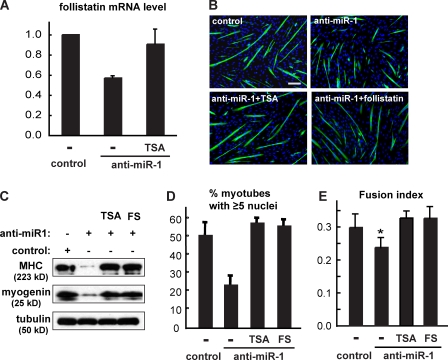
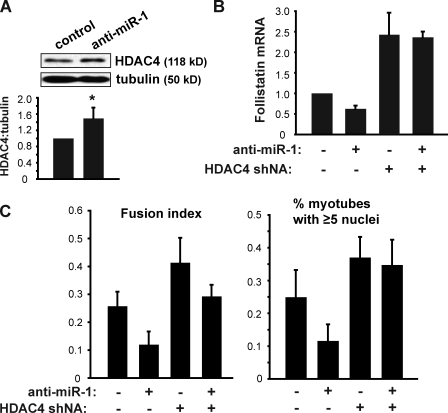
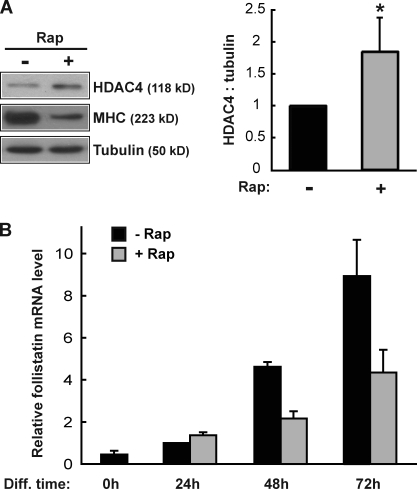
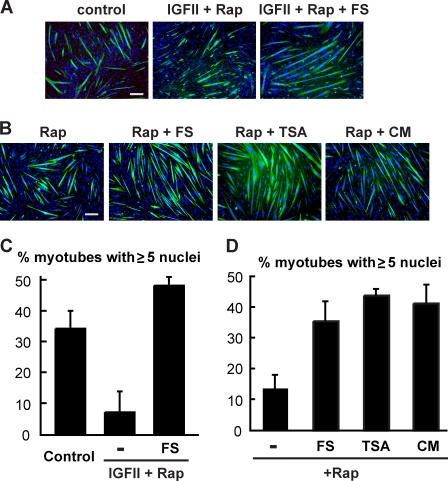
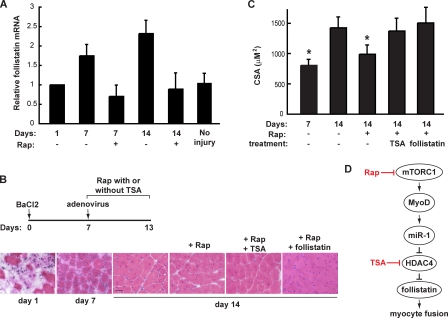
Mammalian target of rapamycin (mTOR) has emerged as a key regulator of skeletal muscle development by governing distinct stages of myogenesis, but the molecular pathways downstream of mTOR are not fully understood. In this study, we report that expression of the muscle-specific micro-RNA (miRNA) miR-1 is regulated by mTOR both in differentiating myoblasts and in mouse regenerating skeletal muscle. We have found that mTOR controls MyoD-dependent transcription of miR-1 through its upstream enhancer, most likely by regulating MyoD protein stability. Moreover, a functional pathway downstream of mTOR and miR-1 is delineated, in which miR-1 suppression of histone deacetylase 4 (HDAC4) results in production of follistatin and subsequent myocyte fusion. Collective evidence strongly suggests that follistatin is the long-sought mTOR-regulated fusion factor. In summary, our findings unravel for the first time a link between mTOR and miRNA biogenesis and identify an mTOR-miR-1-HDAC4-follistatin pathway that regulates myocyte fusion during myoblast differentiation in vitro and skeletal muscle regeneration in vivo.


Figures

Figure 1.
Figure 1.
mTOR controls miR-1 levels during myogenesis both in vitro and in vivo. (A) C2C12 cells were induced to differentiate in the absence or presence of 50 nM rapamycin (Rap). RNA was isolated at the indicated time points of differentiation (Diff), and miR-1 levels were measured by qRT-PCR. (B) C2C12 cells were transduced with lentiviruses expressing two independent mTOR shRNAs or scrambled shRNA, selected with puromycin, and induced to differentiate. At 72 h of differentiation, cells were lysed and subjected to Western analysis. 59-kD S6K1 has an apparent molecular mass of 70 kD on SDS-PAGE. (C) Cells treated as in B were harvested at the indicated times of differentiation, and miR-1 levels were measured by qRT-PCR. In both A and C, relative levels are shown as fold increase compared with the level at 0 h. (D) TA muscles in mice hind limbs were injured by intramuscular injection of BaCl2 followed by daily intraperitoneal injection of rapamycin. On various days AI, injected muscles were isolated and homogenized for RNA isolation followed by quantitative PCR to determine relative miR-1 levels, shown as fold increase compared with uninjured muscles. Data are presented as mean ± SD (n = 3).
Figure 2.
Figure 2.
miR-1 maturation is not affected by rapamycin. C2C12 cells were induced to differentiate in the absence or presence of 50 nM rapamycin (Rap). RNA was isolated at the indicated time points of differentiation (Diff). (A) Northern blotting was performed to examine miR-1 (22 nucleotides) and pre–miR-1 (73 and 78 nucleotides). Let-7a was blotted as a loading control. (B) qRT-PCR was performed to measure the relative levels of pri–miR-1-1 and pri–miR-1-2. Data shown are the representative results of four independent experiments (A) and the mean ± SD of three independent experiments (B).
Figure 3.
Figure 3.
Rapamycin inhibits miR-1 enhancer activity. (A) C2C12 cells were transfected with the miR-1-2 enhancer reporter or the corresponding enhancerless reporter, induced to differentiate (Diff) in the absence or presence of 50 nM rapamycin (Rap), and lysed for luciferase assays at the times indicated. (B) Cells were transfected as in A and induced to differentiate for 72 h in the presence of 50 nM rapamycin, 100 nM wortmannin (Wort), or 1 µM SB203580 (SB) followed by cell lysis and luciferase assays. The enhancerless reporter activity was subtracted from the enhancer reporter activity for each condition, and the data shown have been normalized with 0 h of activity as 1. Data shown are the mean ± SD of three independent experiments.
Figure 4.
Figure 4.
mTORC1 regulates miR-1 through MyoD. (A) C3H10T1/2 cells were transfected with MyoD for 24 h followed by extraction of total RNA and qRT-PCR to measure relative miR-1 levels. (B) C3H10T1/2 cells were cotransfected with MyoD and the miR-1-2 enhancer reporter (miR-1–Luc) or the MyoD site-mutated reporter (miR-1*–Luc) and induced to differentiate for 24 h followed by luciferase assays. (C) C3H10T1/2 cells were cotransfected with the miR-1-2 enhancer reporter and two different doses of MyoD and induced to differentiate in the absence or presence of 50 nM rapamycin (Rap) for 24 h followed by luciferase assays. (D) C3H10T1/2 cells were transfected as in C but with a single dose of MyoD, induced to differentiate for 1 d, and treated with 50 nM rapamycin for 4 h followed by luciferase assays. For the data in A–D, relative values are shown, with the following samples as references: (A) lower amount of MyoD transfected (100%), (B) miR-1–Luc with MyoD (100%), (C) without MyoD and without Rap (1), and (D) with MyoD without Rap (100%). (E) At the induction of differentiation (Diff; 0 h), confluent C2C12 cells were treated with 50 nM rapamycin with or without 1 µM MG-132 for 4 h followed by cell lysis and Western analysis for endogenous MyoD. (F) C3H10T1/2 cells were transfected with MyoD, grown to confluence, and treated with 50 nM rapamycin in differentiation medium for 4 h followed by Western analysis of the cell lysates for recombinant MyoD. Tubulin is shown as a loading control in E and F. Error bars indicate mean ± SD.
Figure 5.
Figure 5.
Knockdown of HDAC4 enhances follistatin expression and myocyte fusion. C2C12 cells were transduced with lentiviruses expressing shRNA for HDAC4 or a scrambled sequence as negative control (Scram). (A–E) After puromycin selection, the cells were induced to differentiate for 72 h followed by Western analysis of cell lysates (A), qRT-PCR assays to determine the relative levels of follistatin mRNA (B), ELISA to measure relative levels of secreted follistatin protein (C), immunostaining with anti-MHC (green) and DAPI (blue; D), and measurement of fusion index (E). Bar, 50 µm. One-sample t tests were performed in B and C, and a paired two-tailed t test was performed in E. *, P ≤ 0.02. Error bars indicate mean ± SD.
Figure 6.
Figure 6.
miR-1 is required for myocyte fusion through HDAC and follistatin. C2C12 cells were transfected with LNA anti–miR-1 or a scrambled LNA oligo as control and induced to differentiate. To inhibit HDAC activity, 25 nM TSA was added to the growth medium when cell density was ∼60% and removed the next day upon switching to differentiation medium. Where indicated, 0.2 µg/ml recombinant follistatin was added to the medium during the last 2 d of differentiation. (A) Relative follistatin mRNA levels after 2 d of differentiation were determined by qRT-PCR. (B) C2C12 cells after 3 d of differentiation were immunostained with anti-MHC (green) and DAPI (blue). Bar, 100 µm. (C) Myogenic marker expression was examined by Western analysis in 3-d differentiated C2C12 cells. (D and E) The percentage of myotubes containing five or more nuclei (D) and the fusion index (E) were calculated. In E, paired two-tailed t tests were performed to compare each data with the control. FS, follistatin. *, P < 0.05. Error bars indicate mean ± SD.
Figure 7.
Figure 7.
HDAC4 functions downstream of miR-1. (A) C2C12 cells were transfected with LNA anti–miR-1 or a scrambled LNA oligo as control and induced to differentiate for 72 h. HDAC4 protein levels in cell lysates were examined by Western blotting and quantified by densitometry using ImageJ (National Institutes of Health). The ratio of HDAC4 to tubulin was normalized with scrambled LNA as 1. A one-sample t test was performed. *, P < 0.05. (B and C) C2C12 cells were transduced with lentiviruses expressing shRNA for HDAC4 or a scrambled hairpin sequence, puromycin selected, and transfected with anti–miR-1 or scrambled LNA followed by induction of differentiation for 72 h. The cells were subjected to RNA isolation and qRT-PCR to measure follistatin mRNA (B) or characterization of myotube fusion (C) as described in Fig. 6. Error bars indicate mean ± SD (n = 3).
Figure 8.
Figure 8.
Rapamycin leads to increased HDAC4 levels and decreased follistatin levels. (A) C2C12 cells were differentiated for 2 d in the presence or absence of 50 nM rapamycin (Rap), and the lysates were analyzed by Western blotting. Western blots were quantified using ImageJ, and the relative ratio of HDAC4 to tubulin is shown. A one-sample t test was performed. *, P < 0.01. (B) C2C12 cells were induced to differentiate in the absence or presence of 50 nM rapamycin, and total RNA was isolated at the indicated time points of differentiation (Diff). Relative follistatin mRNA levels were measured by qRT-PCR with the 24-h sample without rapamycin as 1. Data shown are mean ± SD of three independent experiments.
Figure 9.
Figure 9.
mTORC1 regulates myocyte fusion through follistatin. (A) C2C12 cells were differentiated in the absence or presence of 300 ng/ml IGF-II and 50 nM rapamycin (Rap) for 3 d. Where indicated, 0.2 µg/ml follistatin (FS) was present during the last 2 d of differentiation. Differentiated cells were immunostained with anti-MHC (green) and DAPI (blue). (B) C2C12 cells stably expressing RR/KI mTOR were induced to differentiate in the presence of 50 nM rapamycin for 3 d. 0.2 µg/ml follistatin was added to the medium for the last 2 d of differentiation. 25 nM TSA was added when the cells were ∼60% confluent and removed the next day upon induction of differentiation. Conditioned medium (CM) was collected daily from parental C2C12 cells that had been induced to differentiate 1 d earlier than the RR/KI mTOR cells and fed to the latter with 50 nM rapamycin added. The cells were immunostained as in A. Bars, 100 µm. (C and D) Percentage of myotubes containing at least five nuclei was calculated from the experiments in A and B, respectively. All data shown are mean ± SD of at least three independent experiments.
Figure 10.
Figure 10.
Follistatin is regulated by mTORC1 during muscle regeneration in vivo. (A) Mouse hind limb TA muscles were injected with BaCl2 followed by daily systemic administration of rapamycin starting 1 d AI. On various days indicated, the injected muscles were isolated and total RNA extracted followed by qRT-PCR to measure levels of follistatin mRNA. Data shown are mean ± SD (n = 3). (B) TA muscles were injected with BaCl2 followed by daily systemic administration of rapamycin (Rap) with or without TSA from day 7 to day 13 AI. For some animals, a single dose of adenovirus-expressing follistatin was injected into the injured TA muscle on day 7 AI. A schematic diagram is shown to summarize the various injections of animals. On days 1, 7, or 14 AI, the animals were sacrificed, and the injured muscles were dissected and cryosectioned followed by hematoxylin and eosin staining. Representative images are shown (n = 7 mice for each time point). Bar, 50 µm. (C) Cross-section areas of regenerating myofibers shown in B were measured. Data shown are mean ± SD (n = 7 mice for each data point). One-way analysis of variance was performed to analyze the data. Significant difference comparing each data point to that of day 14 without treatment; *, P < 0.001. (D) A schematic representation of the myogenic pathway discovered in this study. mTORC1 controls MyoD-dependent expression of miR-1 that targets HDAC4 and subsequently up-regulates the production of follistatin, which in turn governs myocyte fusion in skeletal myogenesis.

Similar articles

Cited by

References

    1. Amthor H., Nicholas G., McKinnell I., Kemp C.F., Sharma M., Kambadur R., Patel K. 2004. Follistatin complexes myostatin and antagonises myostatin-mediated inhibition of myogenesis. Dev. Biol. 270:19–30 10.1016/j.ydbio.2004.01.046 - DOI - PubMed
    1. Baeza-Raja B., Muñoz-Cánoves P. 2004. p38 MAPK-induced nuclear factor-kappaB activity is required for skeletal muscle differentiation: role of interleukin-6. Mol. Biol. Cell. 15:2013–2026 10.1091/mbc.E03-08-0585 - DOI - PMC - PubMed
    1. Bartel D.P. 2004. MicroRNAs: genomics, biogenesis, mechanism, and function. Cell. 116:281–297 10.1016/S0092-8674(04)00045-5 - DOI - PubMed
    1. Bartel D.P. 2009. MicroRNAs: target recognition and regulatory functions. Cell. 136:215–233 10.1016/j.cell.2009.01.002 - DOI - PMC - PubMed
    1. Bodine S.C., Stitt T.N., Gonzalez M., Kline W.O., Stover G.L., Bauerlein R., Zlotchenko E., Scrimgeour A., Lawrence J.C., Glass D.J., Yancopoulos G.D. 2001. Akt/mTOR pathway is a crucial regulator of skeletal muscle hypertrophy and can prevent muscle atrophy in vivo. Nat. Cell Biol. 3:1014–1019 10.1038/ncb1101-1014 - DOI - PubMed

Publication types

LinkOut - more resources