Fibrinogen and beta-amyloid association alters thrombosis and fibrinolysis: a possible contributing factor to Alzheimer's disease
- PMID: 20547128
- PMCID: PMC2895773
- DOI: 10.1016/j.neuron.2010.05.014
Fibrinogen and beta-amyloid association alters thrombosis and fibrinolysis: a possible contributing factor to Alzheimer's disease
Abstract
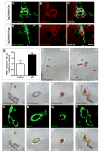
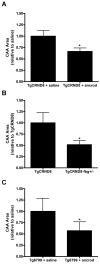
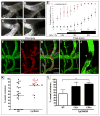
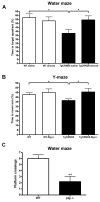
Alzheimer's disease (AD) is a neurodegenerative disorder in which vascular pathology plays an important role. Since the beta-amyloid peptide (Abeta) is a critical factor in this disease, we examined its relationship to fibrin clot formation in AD. In vitro and in vivo experiments showed that fibrin clots formed in the presence of Abeta are structurally abnormal and resistant to degradation. Fibrin(ogen) was observed in blood vessels positive for amyloid in mouse and human AD samples, and intravital brain imaging of clot formation and dissolution revealed abnormal thrombosis and fibrinolysis in AD mice. Moreover, depletion of fibrinogen lessened cerebral amyloid angiopathy pathology and reduced cognitive impairment in AD mice. These experiments suggest that one important contribution of Abeta to AD is via its effects on fibrin clots, implicating fibrin(ogen) as a potential critical factor in this disease.
Copyright 2010 Elsevier Inc. All rights reserved.
Figures


Comment in
-
Neuro-oncology: a molecular staging system for ependymoma.Nat Rev Neurol. 2010 Aug;6(8):414. doi: 10.1038/nrneurol.2010.115. Nat Rev Neurol. 2010. PMID: 20718102 No abstract available.
Similar articles
-
Hyperhomocysteinemia exacerbates Alzheimer's disease pathology by way of the β-amyloid fibrinogen interaction.J Thromb Haemost. 2016 Jul;14(7):1442-52. doi: 10.1111/jth.13340. Epub 2016 Jun 13. J Thromb Haemost. 2016. PMID: 27090576 Free PMC article.
-
Cerebral amyloid angiopathy-linked β-amyloid mutations promote cerebral fibrin deposits via increased binding affinity for fibrinogen.Proc Natl Acad Sci U S A. 2020 Jun 23;117(25):14482-14492. doi: 10.1073/pnas.1921327117. Epub 2020 Jun 9. Proc Natl Acad Sci U S A. 2020. PMID: 32518112 Free PMC article.
-
A novel Aβ-fibrinogen interaction inhibitor rescues altered thrombosis and cognitive decline in Alzheimer's disease mice.J Exp Med. 2014 Jun 2;211(6):1049-62. doi: 10.1084/jem.20131751. Epub 2014 May 12. J Exp Med. 2014. PMID: 24821909 Free PMC article.
-
Fibrinogen and altered hemostasis in Alzheimer's disease.J Alzheimers Dis. 2012;32(3):599-608. doi: 10.3233/JAD-2012-120820. J Alzheimers Dis. 2012. PMID: 22869464 Free PMC article. Review.
-
β-Amyloid Orchestrates Factor XII and Platelet Activation Leading to Endothelial Dysfunction and Abnormal Fibrinolysis in Alzheimer Disease.Alzheimer Dis Assoc Disord. 2021 Jan-Mar 01;35(1):91-97. doi: 10.1097/WAD.0000000000000420. Alzheimer Dis Assoc Disord. 2021. PMID: 33629978 Review.
Cited by
-
Cerebrovascular disorders caused by hyperfibrinogenaemia.J Physiol. 2016 Oct 15;594(20):5941-5957. doi: 10.1113/JP272558. Epub 2016 Jun 16. J Physiol. 2016. PMID: 27121987 Free PMC article.
-
Repositioning medication for cardiovascular and cerebrovascular disease to delay the onset and prevent progression of Alzheimer's disease.Arch Pharm Res. 2020 Sep;43(9):932-960. doi: 10.1007/s12272-020-01268-5. Epub 2020 Sep 9. Arch Pharm Res. 2020. PMID: 32909178 Review.
-
The potential role of ischaemia-reperfusion injury in chronic, relapsing diseases such as rheumatoid arthritis, Long COVID, and ME/CFS: evidence, mechanisms, and therapeutic implications.Biochem J. 2022 Aug 31;479(16):1653-1708. doi: 10.1042/BCJ20220154. Biochem J. 2022. PMID: 36043493 Free PMC article. Review.
-
Three-Dimensional Imaging of Fibrinogen and Neurovascular Alterations in Alzheimer's Disease.Methods Mol Biol. 2023;2561:87-101. doi: 10.1007/978-1-0716-2655-9_5. Methods Mol Biol. 2023. PMID: 36399266 Free PMC article.
-
Approaches to CNS Drug Delivery with a Focus on Transporter-Mediated Transcytosis.Int J Mol Sci. 2019 Jun 25;20(12):3108. doi: 10.3390/ijms20123108. Int J Mol Sci. 2019. PMID: 31242683 Free PMC article. Review.
References
-
- Adams RA, Passino M, Sachs BD, Nuriel T, Akassoglou K. Fibrin mechanisms and functions in nervous system pathology. Mol Interv. 2004;4:163–176. - PubMed
-
- Akassoglou K, Adams RA, Bauer J, Mercado P, Tseveleki V, Lassmann H, Probert L, Strickland S. Fibrin depletion decreases inflammation and delays the onset of demyelination in a tumor necrosis factor transgenic mouse model for multiple sclerosis. Proc Natl Acad Sci U S A. 2004;101:6698–6703. - PMC - PubMed
-
- Akassoglou K, Yu WM, Akpinar P, Strickland S. Fibrin inhibits peripheral nerve remyelination by regulating Schwann cell differentiation. Neuron. 2002;33:861–875. - PubMed
-
- Arriagada PV, Growdon JH, Hedley-Whyte ET, Hyman BT. Neurofibrillary tangles but not senile plaques parallel duration and severity of Alzheimer's disease. Neurology. 1992;42:631–639. - PubMed
-
- Arvinte T, Cudd A, Drake AF. The structure and mechanism of formation of human calcitonin fibrils. J Biol Chem. 1993;268:6415–6422. - PubMed
Publication types
MeSH terms
Substances
Grants and funding
- P50 AG05681/AG/NIA NIH HHS/United States
- T32 GM066699/GM/NIGMS NIH HHS/United States
- GM07739/GM/NIGMS NIH HHS/United States
- R01 NS050537-06/NS/NINDS NIH HHS/United States
- P50 AG005681/AG/NIA NIH HHS/United States
- GM66699/GM/NIGMS NIH HHS/United States
- R01 NS050537-04/NS/NINDS NIH HHS/United States
- T32 GM066699-06/GM/NIGMS NIH HHS/United States
- T32 GM066699-04/GM/NIGMS NIH HHS/United States
- T32 GM007739/GM/NIGMS NIH HHS/United States
- R01 NS050537-05/NS/NINDS NIH HHS/United States
- NS50537/NS/NINDS NIH HHS/United States
- T32 GM066699-05/GM/NIGMS NIH HHS/United States
- R24-MH 068855/MH/NIMH NIH HHS/United States
- R24 MH068855/MH/NIMH NIH HHS/United States
- R01 NS050537-07/NS/NINDS NIH HHS/United States
- R01 NS050537/NS/NINDS NIH HHS/United States
LinkOut - more resources
Full Text Sources
Other Literature Sources
Medical
Molecular Biology Databases

