Fine-scale staging of T cell lineage commitment in adult mouse thymus
- PMID: 20543111
- PMCID: PMC4091773
- DOI: 10.4049/jimmunol.1000679
Fine-scale staging of T cell lineage commitment in adult mouse thymus
Abstract
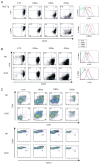
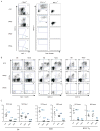
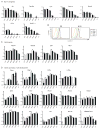
T cell development is marked by the loss of alternative lineage choices accompanying specification and commitment to the T cell lineage. Commitment occurs between the CD4 and CD8 double-negative (DN) 2 and DN3 stages in mouse early T cells. To determine the gene regulatory changes that accompany commitment, we sought to distinguish and characterize the earliest committed wild-type DN adult thymocytes. A transitional cell population, defined by the first downregulation of surface c-Kit expression, was found to have lost the ability to differentiate into dendritic cells and NK cells when cultured without Notch-Delta signals. In the presence of Notch signaling, this subset generates T lineage descendants in an ordered precursor-product relationship between DN2, with the highest levels of surface c-Kit, and c-Kit-low DN3 cells. These earliest committed cells show only a few differences in regulatory gene expression, compared with uncommitted DN2 cells. They have not yet established the full expression of Notch-related and T cell differentiation genes characteristic of DN3 cells before beta selection. Instead, the downregulation of select stem cell and non-T lineage genes appears to be key to the extinction of alternative lineage choices.
Figures


Similar articles
-
Lineage divergence at the first TCR-dependent checkpoint: preferential γδ and impaired αβ T cell development in nonobese diabetic mice.J Immunol. 2011 Jan 15;186(2):826-37. doi: 10.4049/jimmunol.1002630. Epub 2010 Dec 10. J Immunol. 2011. PMID: 21148803 Free PMC article.
-
Progression of T cell lineage restriction in the earliest subpopulation of murine adult thymus visualized by the expression of lck proximal promoter activity.Int Immunol. 2001 Jan;13(1):105-17. doi: 10.1093/intimm/13.1.105. Int Immunol. 2001. PMID: 11133839
-
Enforced expression of Spi-B reverses T lineage commitment and blocks beta-selection.J Immunol. 2005 May 15;174(10):6184-94. doi: 10.4049/jimmunol.174.10.6184. J Immunol. 2005. PMID: 15879115
-
The biology of recent thymic emigrants.Annu Rev Immunol. 2013;31:31-50. doi: 10.1146/annurev-immunol-032712-100010. Epub 2012 Nov 1. Annu Rev Immunol. 2013. PMID: 23121398 Review.
-
The thymus and T-cell commitment: the right niche for Notch?Nat Rev Immunol. 2006 Jul;6(7):551-5. doi: 10.1038/nri1883. Nat Rev Immunol. 2006. PMID: 16799474 Review.
Cited by
-
Tissue-Resident NK Cells: Development, Maturation, and Clinical Relevance.Cancers (Basel). 2020 Jun 12;12(6):1553. doi: 10.3390/cancers12061553. Cancers (Basel). 2020. PMID: 32545516 Free PMC article. Review.
-
OVOL2 sustains postnatal thymic epithelial cell identity.Nat Commun. 2023 Nov 27;14(1):7786. doi: 10.1038/s41467-023-43456-z. Nat Commun. 2023. PMID: 38012144 Free PMC article.
-
The β-selection step shapes T-cell identity.Nature. 2023 Jan;613(7944):440-442. doi: 10.1038/d41586-023-00025-0. Nature. 2023. PMID: 36646871 No abstract available.
-
Mapping the two distinct proliferative bursts early in T-cell development.Immunol Cell Biol. 2023 Sep;101(8):766-774. doi: 10.1111/imcb.12670. Epub 2023 Jul 19. Immunol Cell Biol. 2023. PMID: 37465975 Free PMC article.
-
T-cell identity and epigenetic memory.Curr Top Microbiol Immunol. 2012;356:117-43. doi: 10.1007/82_2011_168. Curr Top Microbiol Immunol. 2012. PMID: 21833836 Free PMC article. Review.
References
-
- Tabrizifard S, Olaru A, Plotkin J, Fallahi-Sichani M, Livak F, Petrie HT. Analysis of transcription factor expression during discrete stages of postnatal thymocyte differentiation. J Immunol. 2004;173:1094–1102. - PubMed
-
- Tydell CC, David-Fung ES, Moore JE, Rowen L, Taghon T, Rothenberg EV. Molecular dissection of prethymic progenitor entry into the T lymphocyte developmental pathway. J Immunol. 2007;179:421–438. - PubMed
Publication types
MeSH terms
Substances
Grants and funding
LinkOut - more resources
Full Text Sources
Molecular Biology Databases
Research Materials

