. 2010 Jun 25;141(7):1146-58.
doi: 10.1016/j.cell.2010.05.008. Epub 2010 Jun 10.

Lysosomal proteolysis and autophagy require presenilin 1 and are disrupted by Alzheimer-related PS1 mutations

Affiliations

Lysosomal proteolysis and autophagy require presenilin 1 and are disrupted by Alzheimer-related PS1 mutations

Ju-Hyun Lee et al. Cell. .

Abstract

Macroautophagy is a lysosomal degradative pathway essential for neuron survival. Here, we show that macroautophagy requires the Alzheimer's disease (AD)-related protein presenilin-1 (PS1). In PS1 null blastocysts, neurons from mice hypomorphic for PS1 or conditionally depleted of PS1, substrate proteolysis and autophagosome clearance during macroautophagy are prevented as a result of a selective impairment of autolysosome acidification and cathepsin activation. These deficits are caused by failed PS1-dependent targeting of the v-ATPase V0a1 subunit to lysosomes. N-glycosylation of the V0a1 subunit, essential for its efficient ER-to-lysosome delivery, requires the selective binding of PS1 holoprotein to the unglycosylated subunit and the Sec61alpha/oligosaccharyltransferase complex. PS1 mutations causing early-onset AD produce a similar lysosomal/autophagy phenotype in fibroblasts from AD patients. PS1 is therefore essential for v-ATPase targeting to lysosomes, lysosome acidification, and proteolysis during autophagy. Defective lysosomal proteolysis represents a basis for pathogenic protein accumulations and neuronal cell death in AD and suggests previously unidentified therapeutic targets.


Figures
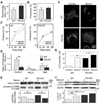
Figure 1
Figure 1
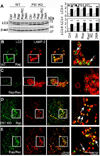
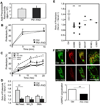
Protein turnover in PS1 KO cells: (A) Incorporation of [3H]-leucine in blastocysts from WT or PS1 KO mice. (B) Following labeling, the proteolysis of short-lived proteins was measured after a chase period. (C) Degradation of long-lived proteins was measured in WT (left panel) and PS1 KO cells (right panel). After incorporation of [3H]-leucine, cells were incubated in serum-supplemented or -deprived medium during the chase period (up to 20 hrs) (* for p <0.05, n=9). (D) The increase in proteolysis at 12 hrs after removal of serum relative to serum-replete conditions was determined for WT and PS1 KO cells that were untreated (control) or treated with NH4Cl or 3MA (** for p <0.001, n=9). (E) Total p70S6K and phospho (Thr389)-p70S6K levels quantified by densitometry, following growth in the presence or absence of serum for 6 hrs (* for p <0.05, n=3). (F) LC3 immunostaining after incubation in the presence and absence of serum. (G) Percentages of cell area occupied by LC3 puncta analyzed using ImageJ software (see Methods) (* for p <0.05 and ** for p <0.001, n=50). (H) LC3-II and LC3-I immunoreactivity and LC3-II/LC3-I ratios by Western blot analysis using tubulin as a loading control (** for p <0.001, n=3). See also Figure S1. All values are the mean ±S.E.M.
Figure 2
Figure 2
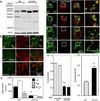
Impaired clearance of LC3-II from autolysosomes in PS1 KO cells: (A) Immunoblot analysis of LC3-I and –II levels in cells under conditions of no treatment (Ctrl), serum starvation (-Ser), rapamycin (Rap), rapamycin treatment followed by rapamycin removal (Rap/RC), and 3MA. WT (B,C) and PS1 KO cells (D,E) analyzed by double-immunofluorescence using LC3 and LAMP-2 antibodies after rapamycin (B,D) or later removal of rapamycin (C,E). Right panels depict enlarged images of the boxed areas seen in the left panels. Scale bar represents 10 µm. ** for p <0.001. See also Figure S2. All values are the mean ±S.E.M.
Figure 3
Figure 3
Cathepsin processing and activity impairment in PS1 KO cells: (A) Cat D immunoblots show reduced generation of the mature two-chain (31 kDa, 14kDa) form in PS1 KO cells, similar to NH4Cl treated (20 mM; 6 hrs) WT cells. (B) In vivo Cat D activity assays using Bodipy-FL-pepstatin A. Following Bodipy-FL-pepstatin A treatment, cells were immunolabeled with Cat D antibody. Bodipy-FL-pepstatin A binds to active Cat D of WT blastocysts and co-localize, but minimal colocalization is shown in PS1 KO cells or WT cells treated with NH4Cl. Scale bar 50 µm. (C) In vitro assays of Cat D enzyme activities in WT and PS1 KO cells with or without rapamycin or NH4Cl. ** for p <0.001. (D–H) Cells with or without rapamycin (10 nM; 6 hrs) were preincubated with LysoTracker and immunolabeled with Cat D antibody (D–G). Cat D-positive compartments were LysoTracker-positive in WT cells (D,E) but LysoTracker-negative in PS1 KO cells (F,G). Scale bars 50 or 10µm. (H) Quantitative analysis of LysoTracker and Cat D-positive compartments. ** p <0.001. (I) Lysosomal pH values were measured ratiometrically using LysoSensor yellow/blue DND-160–Dextran. ** p<0.001. See also Figure S3. Values are means ±S.E.M.
Figure 4
Figure 4
Lysosomal targeting of v-ATPase is impaired in PS1 KO blastocysts: Double-immunofluorescence labeling shows strong colocalization of v-ATPase (V0a1 subunit) and LAMP-2 in WT cells (A) but minimal colocalization in PS1 KO cells (B). v-ATPase V0a1 and early endosomal marker, EEA1, show little colocalization in WT (C) and PS1 KO cells (D). v-ATPase V0a1 and the ER marker, calnexin, strongly colocalized in PS1KO cells (F) but minimally colocalized in WT cells (E). Scale bars 20 or 10µm. (G) Quantitation analysis of v-ATPase V0a1 association with organelle markers. (**for p <0.001). (H) Immunoblots of v-ATPase V0a1 subunit distribution in subcellular fractions of WT and PS1KO cells. Calnexin, primarily localizes in fraction 12 and LAMP2 mainly in fraction 22. In WT cells, the v-ATPase V0a1 subunit, detected as 100 and 120 kDa bands was present in fraction 12 (120 kDa and 100 kDa) and fraction 22 (only in its 120 kDa form), but was primarily detected in the ER-rich fraction (only as a 100 kDa protein) of PS1KO cells. (I) WT and PS1KO cell lysates treated with PNGase F or O-glycanase. The N-glycosylated form of v-ATPase V0a1 subunit (120 kDa) was deglycosylated (100 kDa) after treatment with PNGase F but not with O-glycanase in WT cells. The v-ATPase V0a1 subunit in PS1 KO cells was not N-glycosylated, with the 100 kDa form unchanged by treatment. (J) Insensitivity to Endo H of 100- and 120-kDa bands in WT lysates. Both mature and immature glycosylated forms of nicastrin, serving as a positive control, are EndoH sensitive. (K) Cells incubated 24 hrs with tunicamycin to block glycoprotein synthesis in the ER display reduced levels of 120-kDa v-ATPase V0 subunit in WT cells but no effect on 100-kDa subunit. Nicastrin immunoblot analysis under the same conditions is shown. (L) After cell lysates were incubated with Con A beads, glycoproteins were eluted. Con A binds 120-kDa but not 100 kDa v-ATPase V0a1, and both mature and partially glycosylated nicastrin species. Rab7, a negative control, was not bound. Values are means ±S.E.M.
Figure 5
Figure 5
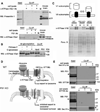
PS1 directly binds to the v-ATPase V0a subunit affecting its maturation and assembly of the v-ATPase complex: (A) Co-immunoprecipitation of endogenous PS1 with anti-v-ATPase V0a1 antibody and v-ATPase V0a1 with anti-PS1-NTF antibody. Precipitated proteins were detected by immunoblot with either anti-PS1 (Ab14) or anti-v-ATPase V0a1. M = marker lane. (B) Lysate from WT mouse brain was treated with PNGase F or O-glycanase. The v-ATPase V0a1 subunit is highly glycosylated in mouse brain. The N-glycosylated form of v-ATPase V0a1 subunit (120 kDa) is deglycosylated (i.e., MW shift to 100 kDa after treatment with PNGase F but not with O-glycanase). The v-ATPase V0a1 subunit was immunoprecipitated with anti-PS1-NTF antibody and detected by anti-v-ATPase V0a1 antibody. Only unglycosylated v-ATPase V0a1 subunit co-precipitates with PS1. (C) Top panel is a model of v-ATPase assembly. Immunoblot shows v-ATPase V1B1 subunit distributes between the membrane and cytosolic fractions. (D) The diagram shows a hypothetical model of N-glycosylation of the v-ATPase V0a1 subunit via PS1. PS1 binding to translocon and OST complex facilitates the presentation of the v-ATPase V0a1 subunit to the OST complex. (E) Co-precipitation of endogenous PS1 with anti-Sec61α antibody and STT3B antibody. Only full length PS1 was co-precipitated with Sec61α and STT3B. Sec61α and STT3B were also co-immunoprecipitated each other. * represents a non-specific band. See also Figure S4.
Figure 6
Figure 6
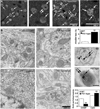
Defective autophagosome accumulation and acidification in PS1 hypomorphic mice. (A) LC3 immunohistochemistry of PS1 hypomorph brain shows greater LC3 staining (arrow) in the PS1 deficient mouse compared to WT. Scale bar - 20 µm. (B) EM of AVs and dystrophic neurite-like structures in brains of PS1 hypomorph mice compared to littermate controls. Scale bar - 500nm. (C) Quantitation of AVs per EM field. ** p <0.001. (D) DAMP, a marker which localizes to acidic compartments, was infused intraventricularly into the brains of mice and analyzed by immuno-EM using DNP (10 nm-gold, arrowheads) and CatD (6 nm-gold, arrows) antibodies. Graphs show quantitation of immunogold labeling for DAMP and CatD. ** p < 0.001. See also Figure S5. All values are means ±S.E.M.
Fig. 7
Fig. 7
Defective autophagy in PS1-FAD human fibroblasts. (A) [3H]-leucine incorporation into fibroblasts from 5 different PS1-FAD patients and age matched controls. (B) After [3H]-leucine labeling, proteolysis of short-lived proteins was measured following the chase period. (C) Degradation of long-lived proteins was measured after incorporation of [3H]-leucine followed by incubation in serum-supplemented or -deprived medium during the chase period (up to 20 hrs) (* for p <0.05, n=15). (D) The increase in proteolysis at 12 hrs after serum removal relative to serum-replete conditions was determined for control and PS1-FAD fibroblasts cells treated with NH4Cl (20 mM) or 3MA (10 mM) (** for p <0.001, n=15), or left untreated. (E) Increases in degradation of long-lived proteins after serum removal were compared in fibroblasts from control (n=11) and PS1-FAD patients carrying different PS1 mutations (as labeled). (F) Control or PS1-FAD fibroblasts treated in the absence of serum were preincubated with LysoTracker and immunolabeled for LAMP-1. LAMP-1-positive compartments colocalized with LysoTracker control cells, but not in PS1-FAD, as verified by quantitative analysis). ** for p <0.001. See also Figure S6, S7. Values are means ±S.E.M.

Comment in

Similar articles

Cited by

References

    1. Anderson RGW, Falck JR, Goldstein JL, Brown MS. Visualization of Acidic Organelles in Intact Cells by Electron Microscopy. Proc Natl Acad Sci. 1984;81:4838–4842. - PMC - PubMed
    1. Auteri JS, Okada A, Bochaki V, Dice JF. Regulation of intracellular protein degradation in IMR-90 human diploid fibroblasts. J Cell Physiol. 1983;115:167–174. - PubMed
    1. Bjorkoy G, Lamark T, Brech A, Outzen H, Perander M, Overvatn A, Stenmark H, Johansen T. p62/SQSTM1 forms protein aggregates degraded by autophagy and has a protective effect on huntingtin-induced cell death. J Cell Biol. 2005;171:603–614. - PMC - PubMed
    1. Boland B, Kumar A, Lee S, Platt FM, Wegiel J, Yu WH, Nixon RA. Autophagy Induction and Autophagosome Clearance in Neurons: Relationship to Autophagic Pathology in Alzheimer's Disease. J Neurosci. 2008;28:6926–6937. - PMC - PubMed
    1. Bolt G, Kristensen C, Steenstrup TD. Posttranslational N-glycosylation takes place during the normal processing of human coagulation factor VII. Glycobiology. 2005;15:541–547. - PubMed

Publication types