. 2010 Jun 7;5(6):e10974.
doi: 10.1371/journal.pone.0010974.

T cells enhance stem-like properties and conditional malignancy in gliomas

Affiliations

T cells enhance stem-like properties and conditional malignancy in gliomas

Dwain K Irvin et al. PLoS One. .

Abstract

Background: Small populations of highly tumorigenic stem-like cells (cancer stem cells; CSCs) can exist within, and uniquely regenerate cancers including malignant brain tumors (gliomas). Many aspects of glioma CSCs (GSCs), however, have been characterized in non-physiological settings.

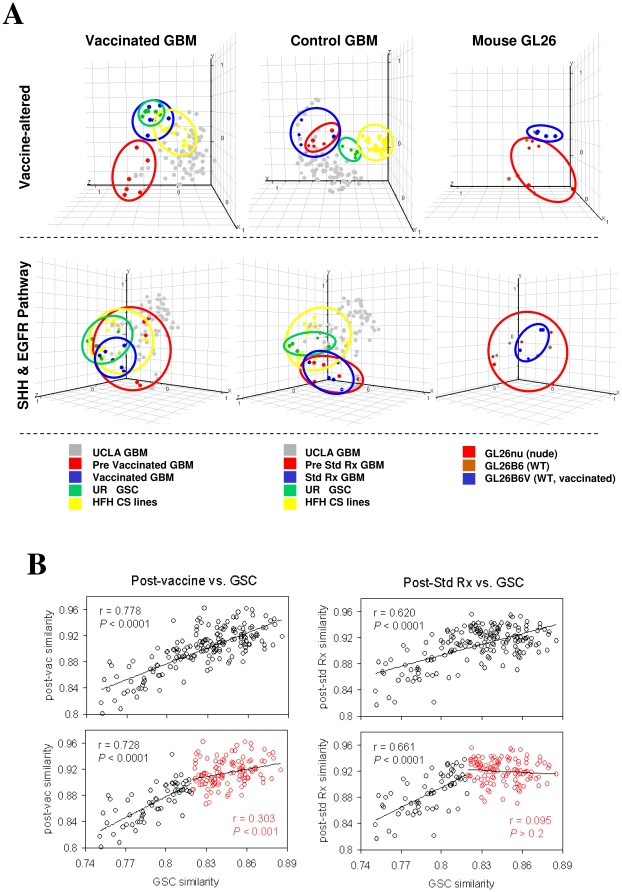
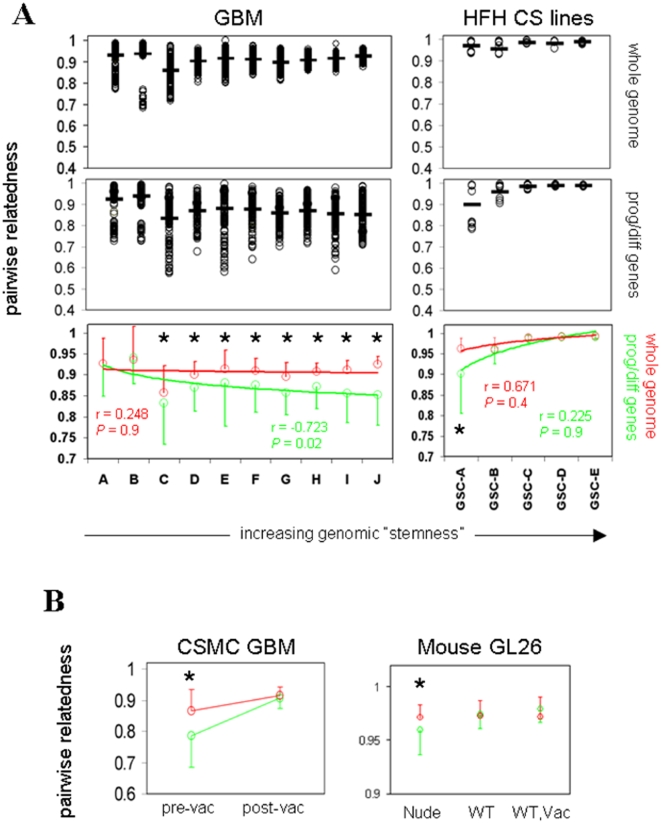
Methods: We found gene expression similarity superiorly defined glioma "stemness", and revealed that GSC similarity increased with lower tumor grade. Using this method, we examined stemness in human grade IV gliomas (GBM) before and after dendritic cell (DC) vaccine therapy. This was followed by gene expression, phenotypic and functional analysis of murine GL26 tumors recovered from nude, wild-type, or DC-vaccinated host brains.

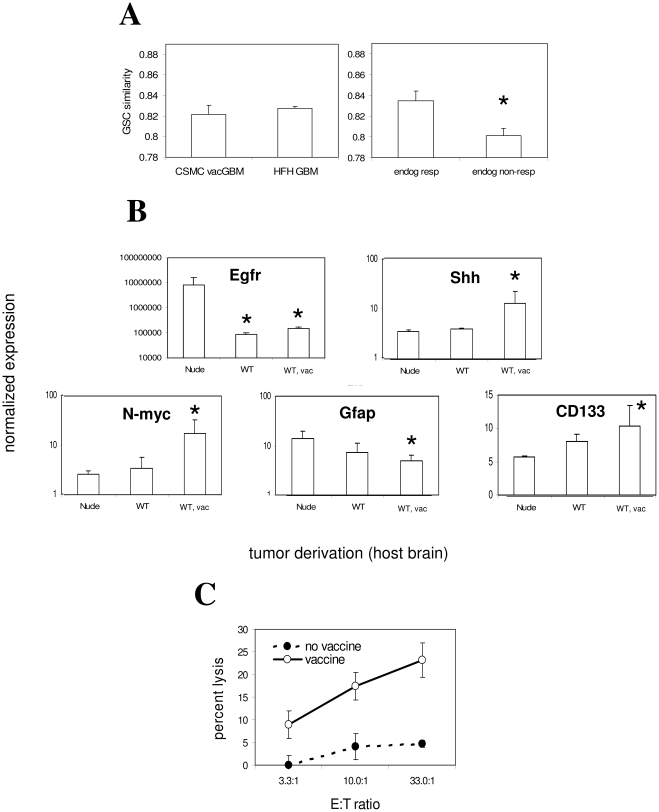
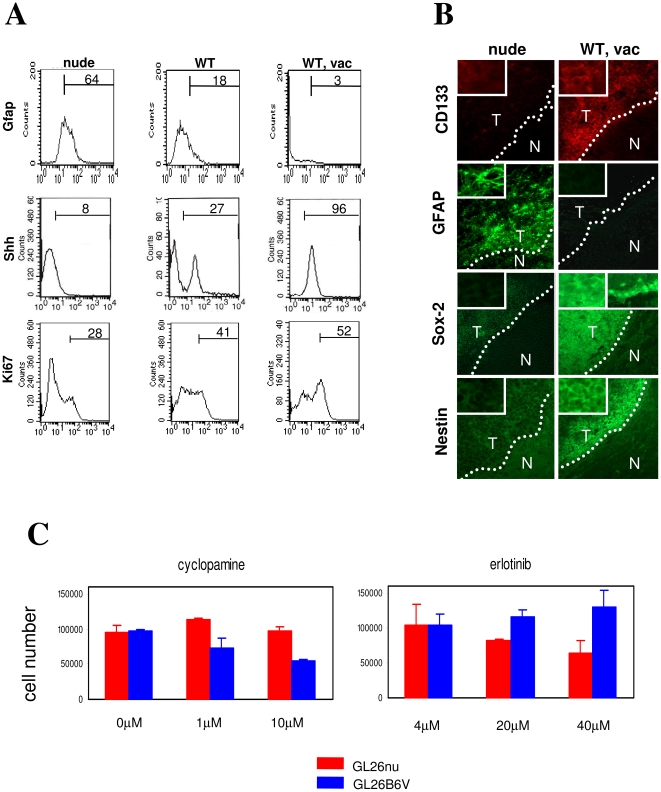
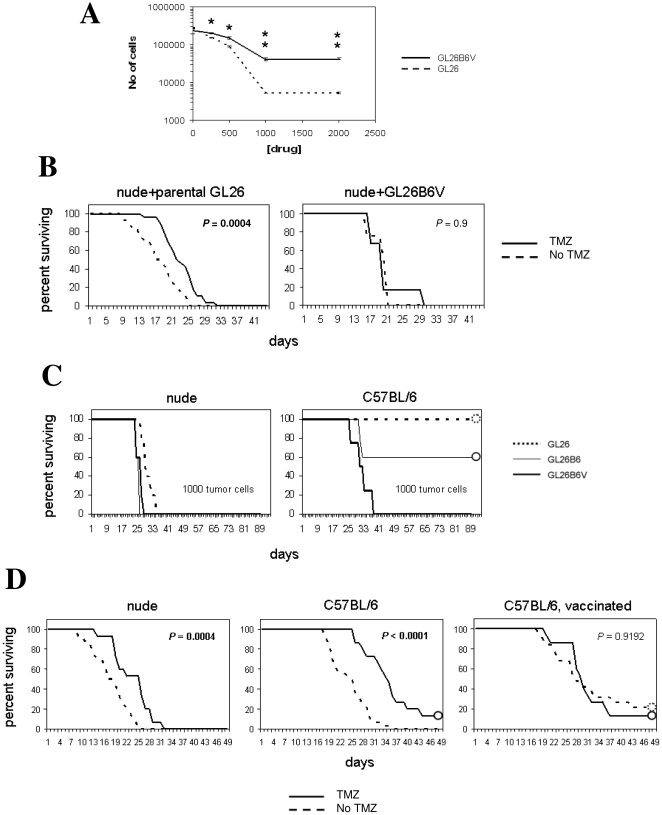
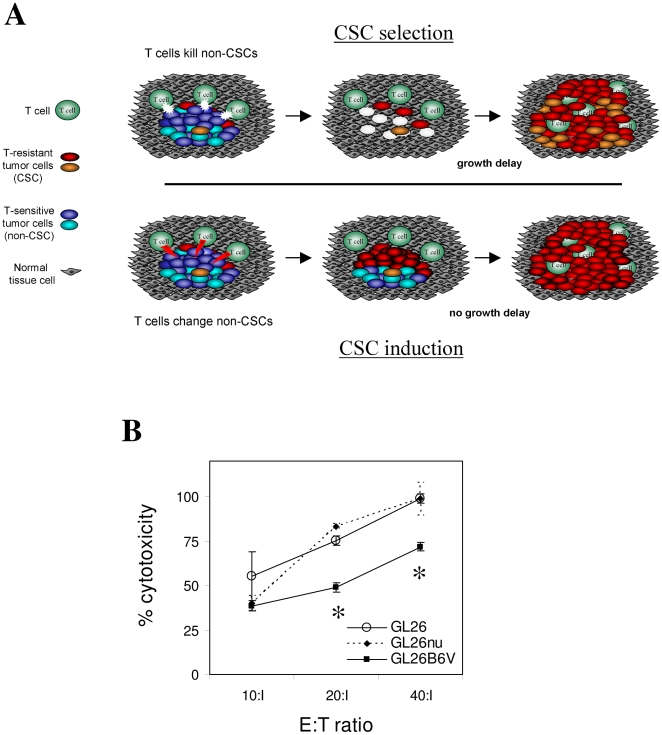
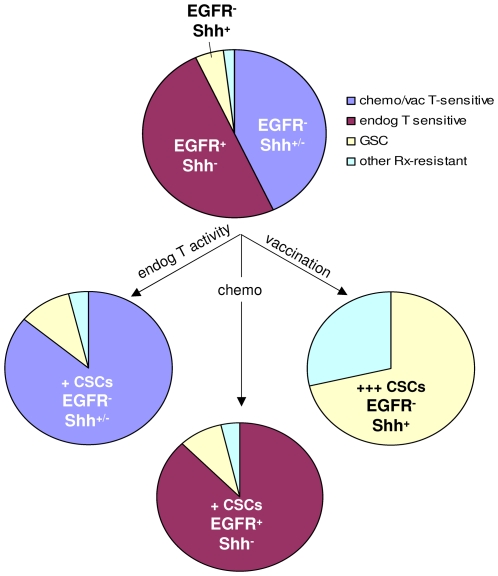
Results: GSC similarity was specifically increased in post-vaccine GBMs, and correlated best to vaccine-altered gene expression and endogenous anti-tumor T cell activity. GL26 analysis confirmed immune alterations, specific acquisition of stem cell markers, specifically enhanced sensitivity to anti-stem drug (cyclopamine), and enhanced tumorigenicity in wild-type hosts, in tumors in proportion to anti-tumor T cell activity. Nevertheless, vaccine-exposed GL26 cells were no more tumorigenic than parental GL26 in T cell-deficient hosts, though they otherwise appeared similar to GSCs enriched by chemotherapy. Finally, vaccine-exposed GBM and GL26 exhibited relatively homogeneous expression of genes expressed in progenitor cells and/or differentiation.

Conclusions: T cell activity represents an inducible physiological process capable of proportionally enriching GSCs in human and mouse gliomas. Stem-like gliomas enriched by strong T cell activity, however, may differ from other GSCs in that their stem-like properties may be disassociated from increased tumor malignancy and heterogeneity under specific host immune conditions.


Conflict of interest statement

Competing Interests: The authors have declared that no competing interests exist.

Figures

Figure 1
Figure 1. Expression microarray profiles of human GBM and mouse glioma.
(A) Principal Component Analyses focused on discrete gene lists were plotted in GeneSpring GX 7.3, and group clusters circled, on: 59 GBMs from UCLA database (“UCLA GBM”; GEO accession #GSE4412), 12 GBMs from 6 patients collected before and after DC vaccination (“vaccinated GBM”; GEO accession #GSE9166); 10 GBMs from 5 patients collected before and after standard radiation and/or chemotherapy (“control GBM”; GEO accession #GSE9166) (red); CD133- and CD133+ CSCs from 6 University of Regensberg GBM patients (“UR GSC”; GEO accession #GDS2728) (green); stem cell media-cultured GBM lines from 2 Henry Ford Hospital patients (“HFH CS lines”; GEO accession #GSE4536); murine GL26 glioma samples recovered and cultured ≤8 passages from brains of 5 nude (GL26nu), 4 C57BL/6J (GL26B6) and 4 C57BL/6J mice vaccinated with 107 tumor lysate-pulsed DC2.4 cells 3 and 7d post -tumor implantation (GL26B6V; GEO accession #GSE9166). Post-vaccine GBM uniquely exhibited co-clustering with UCLA glioma progenitors within vaccine altered genes (top row), and similarly constrained expression of SHH and EGFR pathway genes (middle row). Glioma progenitors also exhibited constrained immune modulator gene expression (Fig. S1A). GL26B6V exhibited parallel trends in all analogous gene lists (right column). (B) Primary GBM microarray expression values from 200 Henry Ford Hospital patients (GEO accession #GSE4536) were assessed for similarity to averaged expression values of 6 UCLA glioma CSCs by determining Pearson's coefficients across 54,674 transcripts, and arranged in order of ascending coefficient values. Pearson's coefficients for similarity to the post-vaccine expression profile across all transcripts (averaged from 6 GBM patient samples) were determined, plotted against the first set of coefficients for each patient, and correlation between CSC and vaccine-induced expression profiles calculated using exponential trendlines. This analysis was repeated after subdivision of GBM patients into low (black) and high (red) CSC similarity according to median of relevant Pearson's coefficients (bottom panels).
Figure 2
Figure 2. Regulation of stem-like gene expression in proportion to anti-tumor T cell activity.
(A) CSC similarity (Pearson's coefficient for similarity to GSCs – GEO accession #GDS2728 - across all transcripts) from 200 Henry Ford Hospital GBM patients (GEO accession #GSE4536) and 6 CSMC GBM patients was assessed and found to be statistically identical, demonstrating absence of relevant bias in CSMC patients (left panel). Division of CSMC patients according to median pre-vaccine anti-tumor response levels as described revealed significantly lower GSC similarity in low anti-tumor responders (0.84±0.01 vs. 0.81±0.01; P<0.05, one-tailed T-test; n = 3 per group), and this levels was also significantly lower than average of HFH patients (P<0.04; one-tailed T-test). (B) Quantitative PCR was performed using primers to the indicated genes, and products quantified by SybrGreen on an iCycler system (BioRad, Hercules, CA). RNA was derived from 3 independent low-passage sublines per strain (3–5 passages after brain recovery). Asterisks denote significant difference in GAPDH-normalized expression of each of the indicated genes in WT or WT, vac-recovered relative to nude-recovered GL26 cells by ANOVA. Gli1 expression was also marginally but significantly increased in GL26B6V relative to GL26nu (not shown; 18.9% relative to GAPDH; P<0.002; two-tailed T-test). All reactions were performed in triplicate for each individual tumor subline (3 sublines per host type). (C) CTL responses of immunocompetent and vaccinated GL26-bearing mice. CTL activity of splenocytes from glioma hosts. CTL activity of ex vivo-stimulated splenocytes (7 days) from non-vaccinated and vaccinated symptomatic, intracranial GL26-bearing mice against cultured GL26 cells was assessed by tetrazolium assay, and plotted as GL26 lysis–spontaneous (effector + responder)lysis/total lysis. Raw values at higher E:T ratios were significantly higher those of the lowest E:T ratio in non-vaccinated controls (P<0.02 for 10:1, P<0.003 for 33:1 E:T ratios, respectively; ANOVA).
Figure 3
Figure 3. Stem-like protein expression and function modulated by T cell activity.
(A) Flow cytometric staining and analysis was performed on GL26 tumor section from brains of nude (GL26nu), C57BL6J (WT; not shown), and C57BL/6J mice vaccinated with 2×10⁶ GL26 lysate-pulsed DC2.4 cells 3 and 7 days post-tumor implantation (“WT, vac”). Percentage of positive cells appears above gating bar. Markers shown had significantly different (P<0.05) positive cell percentages in 3 independent samples of GL26nu and GL26B6V cells by ANOVA and/or one-tailed T-test. (B) Immunofluorescence staining was performed on GL26 tumor section from brains of nude, and C57BL/6J mice vaccinated with 2×10⁶ GL26 lysate-pulsed DC2.4 cells 3 and 7 days post-tumor implantation (“WT, vac”). Results are representative of ≥ samples/group, with the exception of CD133, which revealed strongly positive tumor staining in 2 of 4 brains. WT brains generally exhibited staining similar to nude, or intermediate staining between that of nude and WT, vac (not shown). Marker expression of WT, vac (Prominin+, GFAP-, Sox-2+, Nestin+) is characteristic of cancer stem cells. However, Sox-2 expression was not isolated to nuclei in WT, vac GL26 (right panel, top left inset), though Sox-2 staining of contralateral ventricular cells in the same brain was (right panel, top right inset). (C) Cell numbers in absence or presence of the indicated concentrations of Erlotinib (Tarceva) or Cyclopamine were determined for low-passage (≤5) GL26nu and GL26B6V by Coulter counter. Differences between GL26nu and GL26B6V for either drug, and between erlotinib and cyclopamine within the same recovered tumor lines were significant (P<0.03 by one-tailed T-Test and ANOVA), at concentrations above 4 uM. Distinct glioma lines exhibited opposite patterns of drug sensitivity: GL26nu cells were sensitive to erlotinib but not to cyclopamine, and GL26B6V cells were sensitive to cyclopamine but not to erlotinib, consistent with their reciprocal expression of EGFR and SHH target genes.
Figure 4
Figure 4. In Vitro and in vivo drug resistance of vaccine treated vs. non-treated tumor cells.
A) Cell numbers ± indicated concentrations of temozolamide were determined for low-passage (≤5) GL26nu and GL26B6V with a Coulter counter. Cell numbers were significantly different (P>0.7; one-tailed T-test) between GL26nu and GL26B6V at all drug concentrations, and trends were significantly different among 3 independent sublines of these tumors. (B) Female nude mice (Harlan, Inc.) were injected intracranially with 50,000 GL26 tumor cells, or 50,000 GL26B6V tumor cells, treated by i.v. injection 7, 8, & 9 days post-tumor implantation with 10 mg/kg temozolamide (TMZ) in 1% DMSO, and days to survival assessed by log-rank. GL26-implanted mice survived significantly longer (P<0.003) with temozolamide treatment, while GL26B6V-implanted mice did not (P>0.7). (C) Female wild-type C57BL/6J (Jackson Labs; right panel) or nude mice (Harlan, Inc.; left panel) as indicated were injected intracranially with indicated doses of GL26 (n = 5), GL26B6 (n = 5), or GL26B6V (n = 5) tumor cells, and days to survival assessed by log-rank. GL26-implanted survived significantly longer (P<0.0001; Mantel-Cox log-rank) than GL26B6V-implanted wild-type mice at doses up to 50,000 cells (not shown), but only just achieved significantly longer survival in nude mice at doses of 25 cells (P = 0.049; Mantel-Cox log-rank, not shown). (D) Survival between GL26-implanted nude (n = 28), untreated C57BL/6J (n = 32), and C57BL/6J mice vaccinated with 2×10⁶ GL26 lysate-pulsed DC2.4 cells 3 and 7 days post-tumor implantation (n = 19) was assessed with and without subsequent temozolamide (TMZ) treatment as above, by Mantel-Cox log-rank statistics. DC-vaccinated hosts survived significantly longer relative to untreated wild-type and nude mice implanted simultaneously with 50,000 original GL26 tumor cells (P<0.003).
Figure 5
Figure 5. Selection vs. induction of stem-like properties in gliomas.
(A) Expected appearance of gliomas under alternative mechanisms of selection of pre-existing glioma stem cells (top panel) vs. induction of stem-like genetic program (bottom panel) via vaccination. The present data best support the occurrence of immune-mediated glioma CSC selection with or without prior immune induction of these cells. (B) Vaccine-exposed (GL26B6V) and parental GL26 were co-incubated with indicated ratios of HTB-156.7.7 (an H-2Kb-reactive T hybridoma [39]), and assessed for killing. A representative of 3 independent assays is shown. GL26B6V exhibited relative resistance to killing, consistent with a selection mechanism for T cell-mediated enrichment of stem-like gliomas. Asterisks denote significantly reduced specific lysis in triplicate wells (P>0.05 by single-sided T-test).
Figure 6
Figure 6. Genetic diversity and stem-like properties in GBM.
(A) Henry Ford Hospital GBM (“GBM”, total n = 200), and cultured GBM lines grown in stem cell media (“HFH CS lines”, total n = 23) as indicated (GEO accession #GSE4536 for both), were arranged in groups with increasing global CSC similarity as in Fig. 1B (n = 20/group for GBM, groups A-J; n = 5 for 4 groups, and n = 3 for the most stem-like group for GBM progenitors; groups GSC-A through -E), each with progressively increased CSC similarity, and intra-group pair-wise relatedness assessed by Pearson's correlation matrix across all transcripts, and within genes involved in differentiation/progenitor cell function (publically posted by Superarray, Inc.) as indicated. Range and average (horizontal bar) of individual coefficients are plotted in uncolored panels, with compiled averages ± SEM for all transcripts and differentiation/progenitor genes combined in colored panels. Significant differences in intra-group similarity between the two gene sets are denoted by asterisks (P<0.01; ANOVA). (B) Pre- and post-vaccine CSMC GBM (left panel; n = 6 matched pairs), and mouse GL26 microarray samples recovered from nude, syngeneic C57BL/6 (“WT”), or DC-vaccinated C57BL/6 (“Vac”; right panel; n≥4/group, as described in Fig. 1A), were grouped and assessed for intra-group pair-wise relatedness by generating Pearson's correlation matrices across all transcripts, or for differentiation/progenitor cell genes as above. Compiled averages ± SEM for all transcripts (red) and differentiation/progenitor genes (green) were plotted, with significant differences between these two parameters denoted by asterisks (P<0.01; ANOVA).
Figure 7
Figure 7. Model for vaccine-induced stem-like properties in gliomas.
Model accounting for qualitatively and quantitatively distinct enrichment of glioma CSCs by endogenous T cells, chemotherapy and vaccination. The model takes distinct synergy of endogenous and vaccine-mediated T cell activity with chemotherapy, and therapy-mediated marker dynamics into account. In the absence of any T cells, substantial numbers of Egfr+ tumor cells are expected to persist, whereas T cells down-regulate Egfr and proportionally up-regulate Shh expression.

Similar articles

Cited by

References

    1. Singh SK, Hawkins C, Clarke ID, Squire JA, Bayani J, et al. Identification of human brain tumour initiating cells. Nature. 2004;432 - PubMed
    1. Singh SK, Clarke ID, Terasaki M, Bonn VE, Hawkins C, et al. Identification of a cancer stem cell in human brain tumors. Cancer Res. 2003;63:5821–5828. - PubMed
    1. Sanai N, Alvarez-Buylla A, Berger MS. Neural stem cells and the origin of gliomas. N Engl J Med. 2005;353:811–822. - PubMed
    1. Piccirillo SGM, Reynolds BA, Zanetti N, Lamorte G, Binda E, et al. Bone morphogenetic proteins inhibit the tumorigenic potential of human bran tumour-initiating cells. Nature. 2006;444:761–765. - PubMed
    1. Ridgway J, Zhang G, Wu Y, Stawicki S, Liang W-C, et al. Inhibition of Dll4 signalling inhibits tumour growth by deregulating angiogenesis. Nature. 2006;444:1083–1087. - PubMed

Publication types