Dietary methionine restriction enhances metabolic flexibility and increases uncoupled respiration in both fed and fasted states
- PMID: 20538896
- PMCID: PMC2944433
- DOI: 10.1152/ajpregu.00837.2009
Dietary methionine restriction enhances metabolic flexibility and increases uncoupled respiration in both fed and fasted states
Abstract
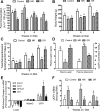
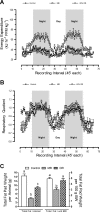
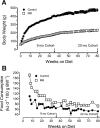
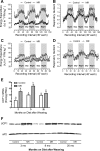
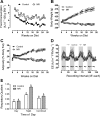
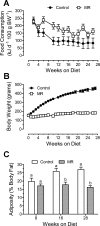
Dietary methionine restriction (MR) is a mimetic of chronic dietary restriction (DR) in the sense that MR increases rodent longevity, but without food restriction. We report here that MR also persistently increases total energy expenditure (EE) and limits fat deposition despite increasing weight-specific food consumption. In Fischer 344 (F344) rats consuming control or MR diets for 3, 9, and 20 mo, mean EE was 1.5-fold higher in MR vs. control rats, primarily due to higher EE during the night at all ages. The day-to-night transition produced a twofold higher heat increment of feeding (3.0 degrees C vs. 1.5 degrees C) in MR vs. controls and an exaggerated increase in respiratory quotient (RQ) to values greater than 1, indicative of the interconversion of glucose to lipid by de novo lipogenesis. The simultaneous inhibition of glucose utilization and shift to fat oxidation during the day was also more complete in MR (RQ approximately 0.75) vs. controls (RQ approximately 0.85). Dietary MR produced a rapid and persistent increase in uncoupling protein 1 expression in brown (BAT) and white adipose tissue (WAT) in conjunction with decreased leptin and increased adiponectin levels in serum, suggesting that remodeling of the metabolic and endocrine function of adipose tissue may have an important role in the overall increase in EE. We conclude that the hyperphagic response to dietary MR is matched to a coordinated increase in uncoupled respiration, suggesting the engagement of a nutrient-sensing mechanism, which compensates for limited methionine through integrated effects on energy homeostasis.
Figures
Similar articles
-
UCP1 is an essential mediator of the effects of methionine restriction on energy balance but not insulin sensitivity.FASEB J. 2015 Jun;29(6):2603-15. doi: 10.1096/fj.14-270348. Epub 2015 Mar 5. FASEB J. 2015. PMID: 25742717 Free PMC article.
-
Role of beta-adrenergic receptors in the hyperphagic and hypermetabolic responses to dietary methionine restriction.Am J Physiol Regul Integr Comp Physiol. 2010 Sep;299(3):R740-50. doi: 10.1152/ajpregu.00838.2009. Epub 2010 Jun 16. Am J Physiol Regul Integr Comp Physiol. 2010. PMID: 20554934 Free PMC article.
-
Short-term, increasing dietary protein and fat moderately affect energy expenditure, substrate oxidation and uncoupling protein gene expression in rats.J Nutr Biochem. 2007 Jun;18(6):400-7. doi: 10.1016/j.jnutbio.2006.07.005. Epub 2006 Sep 15. J Nutr Biochem. 2007. PMID: 16979329
-
Transcriptional impact of dietary methionine restriction on systemic inflammation: relevance to biomarkers of metabolic disease during aging.Biofactors. 2014 Jan-Feb;40(1):13-26. doi: 10.1002/biof.1111. Epub 2013 Jun 29. Biofactors. 2014. PMID: 23813805 Free PMC article. Review.
-
The Origins, Evolution, and Future of Dietary Methionine Restriction.Annu Rev Nutr. 2022 Aug 22;42:201-226. doi: 10.1146/annurev-nutr-062320-111849. Epub 2022 May 19. Annu Rev Nutr. 2022. PMID: 35588443 Free PMC article. Review.
Cited by
-
Effects of Weight Loss and Moderate-Protein, High-Fiber Diet Consumption on the Fasted Serum Metabolome of Cats.Metabolites. 2021 May 18;11(5):324. doi: 10.3390/metabo11050324. Metabolites. 2021. PMID: 34070109 Free PMC article.
-
Sexually Dimorphic Effects of Dietary Methionine Restriction are Dependent on Age when the Diet is Introduced.Obesity (Silver Spring). 2020 Mar;28(3):581-589. doi: 10.1002/oby.22721. Epub 2020 Feb 3. Obesity (Silver Spring). 2020. PMID: 32012481 Free PMC article.
-
Bone Marrow Adiposity: Basic and Clinical Implications.Endocr Rev. 2019 Oct 1;40(5):1187-1206. doi: 10.1210/er.2018-00138. Endocr Rev. 2019. PMID: 31127816 Free PMC article. Review.
-
FGF21 as a mediator of adaptive changes in food intake and macronutrient preference in response to protein restriction.Neuropharmacology. 2024 Sep 1;255:110010. doi: 10.1016/j.neuropharm.2024.110010. Epub 2024 May 24. Neuropharmacology. 2024. PMID: 38797244 Review.
-
FGF21 Mediates the Thermogenic and Insulin-Sensitizing Effects of Dietary Methionine Restriction but Not Its Effects on Hepatic Lipid Metabolism.Diabetes. 2017 Apr;66(4):858-867. doi: 10.2337/db16-1212. Epub 2017 Jan 17. Diabetes. 2017. PMID: 28096260 Free PMC article.
References
-
- Bouillaud F, Ricquier D, Mory G, Thibault J. Increased level of mRNA for the uncoupling protein in brown adipose tissue of rats during thermogenesis induced by cold exposure or norepinephrine infusion. J Biol Chem 259: 11583–11586, 1984 - PubMed
-
- Commins SP, Marsh DJ, Thomas SA, Watson PM, Padgett MA, Palmiter RD, Gettys TW. Norepinephrine is required for leptin effects on gene expression in brown and white adipose tissue. Endocrinology 140: 4772–4776, 1999 - PubMed
-
- Commins SP, Watson PM, Frampton IC, Gettys TW. Leptin selectively reduces white adipose tissue in mice via an uncoupling protein-1-dependent mechanism. Am J Physiol Endocrinol Metab 280: E372–E377, 2001 - PubMed
-
- Commins SP, Watson PM, Levin N, Beiler RJ, Gettys TW. Central leptin regulates the UCP1 and ob genes in brown and white adipose tissue via different β-adrenoceptor subtypes. J Biol Chem 275: 33059–33067, 2000 - PubMed
-
- Commins SP, Watson PM, Padgett MA, Dudley A, Argyropoulos G, Gettys TW. Induction of uncoupling protein expression in brown and white adipose tissue by leptin. Endocrinology 140: 292–300, 1999 - PubMed
Publication types
MeSH terms
Substances
Grants and funding
LinkOut - more resources
Full Text Sources
Other Literature Sources
Research Materials

