. 2010 Jul 21;29(14):2446-60.
doi: 10.1038/emboj.2010.116. Epub 2010 Jun 8.

Suppression of the novel ER protein Maxer by mutant ataxin-1 in Bergman glia contributes to non-cell-autonomous toxicity

Affiliations

Suppression of the novel ER protein Maxer by mutant ataxin-1 in Bergman glia contributes to non-cell-autonomous toxicity

Hiroki Shiwaku et al. EMBO J. .

Abstract

Non-cell-autonomous effect of mutant proteins expressed in glia has been implicated in several neurodegenerative disorders, whereas molecules mediating the toxicity are currently not known. We identified a novel molecule named multiple alpha-helix protein located at ER (Maxer) downregulated by mutant ataxin-1 (Atx1) in Bergmann glia. Maxer is an endoplasmic reticulum (ER) membrane protein interacting with CDK5RAP3. Maxer anchors CDK5RAP3 to the ER and inhibits its function of Cyclin D1 transcription repression in the nucleus. The loss of Maxer eventually induces cell accumulation at G1 phase. It was also shown that mutant Atx1 represses Maxer and inhibits proliferation of Bergmann glia in vitro. Consistently, Bergmann glia are reduced in the cerebellum of mutant Atx1 knockin mice before onset. Glutamate-aspartate transporter reduction in Bergmann glia by mutant Atx1 and vulnerability of Purkinje cell to glutamate are both strengthened by Maxer knockdown in Bergmann glia, whereas Maxer overexpression rescues them. Collectively, these results suggest that the reduction of Maxer mediates functional deficiency of Bergmann glia, and might contribute to the non-cell-autonomous pathology of SCA1.


Conflict of interest statement

The authors declare that they have no conflict of interest.

Figures
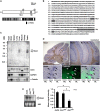
Figure 1
Figure 1
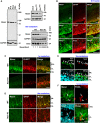
Identification and tissue expression of Maxer. (A) Structure of Maxer protein. NLS, nuclear localization signal; TM, transmembrane domain; P, possible phosphorylation site. Lower scheme shows multiple α-helix (black). (B) Amino-acid sequence of rat Maxer. (C) Tissue expression profiles of Maxer mRNA in adult rat. Northern blot with full-length rat Maxer cDNA. (D) In situ hybridization analysis of Maxer at 8 weeks. Maxer is expressed at Purkinje cell layer (upper panels, purple). Lower panels are higher magnifications of co-staining with anti-calbindin antibody (green, arrowheads). Maxer is expressed in calbindin-negative cells (arrows), but not in calbindin-positive Purkinje cells. ML, molecular layer; PL, Purkinje cell layer; GL; granule cell layer. Bar: 200 μm (upper left), 100 μm (upper right) and 10 μm (lower). (E) Northern blot analysis of primary cerebellar culture prepared at P7. Cells were infected with AxCA (empty vector)-, AxCA-Atx130Q (Atx130Q)- or AxCA-Atx182Q (Atx182Q)-expressing adenovirus vectors. Maxer was reduced by mutant Atx1. The error bars represent s.e.m. n=3, *P<0.01, Student's t-test.
Figure 2
Figure 2
Maxer is expressed in neural stem cells and Bergmann glia. (A) Western blot analysis of Maxer with C15-01D anti-Maxer antibody. C6, P19 and HeLa cells as well as primary cerebellar glia expressed Maxer endogenously (left). Maxer reduction in mutant Atx1-infected primary cerebellar culture (right upper) and in mutant Atx1-KI mouse cerebellum (right lower). (B) Immunohistochemistry of E17 cerebral cortex with anti-Maxer antibody. Cytoplasmic Maxer merged with GLAST (upper and middle panels). Sox2 was expressed in the nuclei of Maxer-positive cells (lower panels). VZ, ventricular zone. Bar: 100 μm. (C) Immunohistochemistry of cerebellum with anti-Maxer antibody at P7, the time point used for our original microarray analysis (Tagawa et al, 2007). Maxer merged with GLAST in Bergmann glia. EGL, external granule cell layer; PL, Purkinje cell layer; IGL, internal granule cell layer. Bar: 20 μm. (D) Maxer was reduced in Bergmann glia of mutant Atx1-KI mice (16 weeks). ML, molecular layer; PL, Purkinje cell layer; GL, granule cell layer. Bar: 20 μm. (E) Immunohistochemistry of cerebellum at 16 weeks. Purkinje cell nuclei (arrow) and Sox2-positive Bergmann glia nuclei (arrowheads) were stained with Atx1 (anti-ataxin-1 antibody 11NQ) and DAPI. Bar: 20 μm. (F) PCNA-positive cells expressed Maxer at P7 (arrows). Bar: 20 μm.
Figure 3
Figure 3
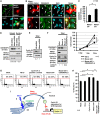
Maxer is a novel ER protein. (A) Confocal images show colocalization of Maxer and ER-DsRed in HeLa cells. Higher magnifications are shown from the fourth to sixth lines. Maxer 1–711 is colocalized with ER-DsRed, whereas Maxer 1–683 showed diffuse distribution. Single transfection of Maxer or ER-DsRed did not make signals that bleed through fluorescence. Bar: 10 or 1 μm in higher magnification. (B) Deletion constructs of Maxer–EGFP (left). Maxer and Maxer 1–711 were enriched in cellular membrane fraction of HeLa cells, whereas Maxer 1–683 was enriched in cytosolic fraction (right); α-tubulin and calnexin were used as cytosolic and membrane fraction marker, respectively. (C) Density gradient fractionation showed Maxer enrichment in ER, but not golgi or mitochondria. Calnexin (ER), golgi 58 K (golgi) and Tom70 (mitochondria) were used as organelle markers. (D) Confocal images showed colocalization of endogenous Maxer and ER-DsRed. Bar: 10 μm.
Figure 4
Figure 4
Maxer interacts with CDK5RAP3. (A) Cell lysates from EGFP or EGFP–Maxer-expressing HeLa cells are subjected to precipitation by anti-EGFP antibody and blotted by indicated antibodies. (B) Deletion constructs of Maxer–EGFP were used for immunoprecipitation. The binding domain to CDK5RAP3 was shaded. (C) Confocal images showed colocalization of EGFP–Maxer and CDK5RAP3. Bar: 5 μm.
Figure 5
Figure 5
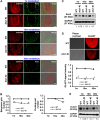
Maxer regulates nuclear translocation of CDK5RAP3. (A) Endogenous Maxer was reduced in Maxer-shRNA/DsRed-transfected HeLa cell (dotted). Maxer-shRNA and DsRed are expressed from a plasmid. Bar: 20 μm. (B) Transfection of Maxer-shRNA/DsRed increased nuclear CDK5RAP3 in HeLa cells. Arrow: shRNA-transfected cells, arrowhead: non-transfected cells. Bar: 20 μm. (C) Quantification of CDK5RAP3 intensity in the nuclei by MetaMorph. Mean+s.d. n=100, *P<0.01. Three independent experiments showed the similar result. (D) Western blot analysis shows the increase of CDK5RAP3 in the nuclear fraction of Maxer-shRNA-transfected cells. GAPDH and HDAC3 were cytoplasmic and nuclear marker, respectively. The ratio below the panel indicates CDK5RAP3 intensity in comparison with non-silencing (NS) shRNA. (E) Cyclin D1 expression level was reduced in Maxer-shRNA-transfected cells. The ratio indicates GAPDH-corrected signal intensity of cyclin D1. (F) C6 glioma cells were transfected with NS siRNA, Maxer-siRNA#1 or Maxer-siRNA + CDK5RAP3-siRNA. Their effects on protein expression (western blots, left) and on cell proliferation (graph, right) were simultaneously analysed. Co-transfection of CDK5RAP3-siRNA rescued cyclin D1 and proliferation suppressed by Maxer-siRNA#1. Error bar: s.e.m. n=3, *P<0.01. The ratio indicates GAPDH-corrected intensity of CDK5RAP3. (G) C6 glioma cells were transfected with siRNAs indicated above the panels. Fluorescence-activated cell sorter (FACS) analysis was performed at 72 h after transfection. Histograms with 10 000 cells indicated G1 accumulation by Maxer knockdown. Cyclin D1-siRNA was a positive control. Co-transfection of CDK5RAP3-siRNA rescued the G1 accumulation by Maxer-siRNA#1. (H) G1 per cent in multiple FACS analyses was statistically analysed. Error bar: s.d. n=4, *P<0.01. (I) A hypothetical scheme of molecular function of Maxer to regulate G1/S transition through CDK5RAP3 and cyclin D1.
Figure 6
Figure 6
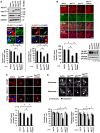
Reduction of Bergmann glia and GLAST in Atx1-KI mice. (A) Bergmann glia were reduced in the cerebellum of mutant Atx1-KI mice. Bergmann glia and Purkinje cells were immunostained with anti-Sox2 antibody and anti-calbindin antibody, respectively. Corresponding cerebellar folia from three different ages (1, 16 and 40 weeks) were analysed. Bar: 50 μm. (B) Quantification of Bergman glia number (left) and Purkinje cell number (right) of three different ages (1, 16 and 40 weeks). Error bar: s.e.m. n=4, *P<0.01, Student's t-test. (C) Western blot analysis with anti-Sox2 antibody to quantify Bergmann glia. The ratio indicates GAPDH-corrected signal intensity of Sox2. (D) Mutant Atx1 expression reduced GLAST in KI mice. Cerebella from WT and Atx1-KI were stained with anti-GLAST antibody (upper). GLAST signal intensity was quantified (lower). The error bars represent s.e.m. n=4 mice, *P<0.01, Student's t-test. Bar: 50 μm. (E) Western blot analysis of GLAST expression in WT and Atx1-KI cerebellum.
Figure 7
Figure 7
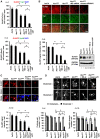
Maxer rescues Purkinje cells from glutamate toxicity through Bergmann glia. (A) Rescue experiment using Maxer-expressing adenovirus. Primary Bergmann glia were prepared at P7 and infected with AxCA (empty vector)-, AxCA-Atx130Q (Atx130Q)-, AxCA-Atx182Q (Atx182Q)- or AxCA-Maxer (Maxer)-expressing adenovirus vectors. Cell lysates were immunobloted with indicated antibodies. Atx1 expression levels were almost equivalent (upper). Bergmann glia were identified either by GLAST/Tuj1 staining (GLAST+/Tuj1−cells) or by GLAST/Sox2 staining (GLAST+/Sox2+cells) (middle). Bergmann glia number was quantified (lower). Mutant Atx1 suppressed proliferation of Bergmann glia, but co-expression of Maxer rescued the proliferation in primary culture. The error bars represent s.e.m. n=4, *P<0.01, Student's t-test. Bar: 10 μm. (B) Co-expression of Maxer rescued suppression of GLAST by Atx182Q. Primary cerebellar cell culture was prepared at P7 and infected with indicated adenovirus vectors as in (A). Cells were immunostained with anti-GLAST and anti-Tuj1 antibodies (upper). The signal intensities of GLAST were quantified (lower left). In parallel, cell lysates were blotted with anti-GLAST antibody (lower right). The error bars represent s.e.m. n=5, *P<0.01, Student's t-test. Bar: 100 μm. (C) Co-expression of Maxer rescued suppression of GLAST by Atx182Q at a single cell level. Primary cerebellar cell culture after infection was stained with anti-GLAST and anti-ataxin-1 antibodies (upper). GLAST signal intensities were quantified at a single cell level (lower). The error bars represent s.d. n=10, *P<0.05, Student's t-test. Bar: 10 μm. (D) Bergmann glia–Purkinje cell co-culture was exposed to 50 μM of glutamate. Cells were infected with indicated adenovirus vectors. Purkinje cell number and Purkinje branch complexity were significantly reduced when Bergmann glia were infected with Atx182Q and rescued with co-expression of Maxer (lower). Purkinje cells were visualized by anti-calbindin antibody (upper: representative cells). For Purkinje cell number, the error bars represent s.e.m. n=4, *P<0.05, Student's t-test. For Purkinje branch complexity, the error bars represent s.d. n=10, *P<0.05, Student's t-test. Four independent experiments showed the similar results. Bar: 10 μm.
Figure 8
Figure 8
Maxer knockdown accelerates glutamate toxicity on Purkinje cells. (A) Co-expression of Maxer-RNAi enhanced suppression of Bergmann glia proliferation by Atx182Q. Primary culture of cerebellar cells (P7) were infected with adenovirus vectors or transfected with Maxer siRNA#1 or NS siRNA. Bergmann glia were identified either by GLAST/Tuj1 staining (GLAST+/Tuj1−cells) or by GLAST/Sox2 staining (GLAST+/Sox2+cells) 4 days after the transfection. The error bars represent s.e.m. n=4, *P<0.01, Student's t-test. (B) Co-expression of Maxer-RNAi further suppressed Atx182Q-induced suppression of GLAST. Primary cerebellar culture cells (P7) were prepared as in (A) and double stained with anti-GLAST antibody and anti-Tuj1 antibody (upper). GLAST intensities were quantified (lower left). Simultaneously, cell lysates were blotted with anti-GLAST antibody (lower right). The error bars represent s.e.m. n=5, *P<0.01, Student's t-test. Bar: 100 μm. (C) Co-expression of Maxer-RNAi enhanced Atx182Q-induced suppression of GLAST at a single cell level. Primary cerebellar culture cells were prepared and double stained with anti-GLAST antibody and anti-Atx1 antibody (upper). GLAST signal intensity was quantified at a single cell level (lower). The error bars represent s.d. n=10, *P<0.05, Student's t-test. Three different experiments showed the similar result. Bar: 10 μm. (D) Bergmann glia–Purkinje cell co-culture was exposed to 50 μM of glutamate. Purkinje cell number and Purkinje branch complexity were significantly reduced when Bergmann glia were infected with Atx182Q (lower). Co-expression of Maxer-siRNA further suppressed the Purkinje cell number and its branch complexity (lower). Purkinje cells were visualized with anti-calbindin antibody (upper: representative cells). For Purkinje cell number, the error bars represent s.e.m. n=4, *P<0.05, Student's t-test. For Purkinje branch complexity, the error bars represent s.d. n=10, *P<0.05, Student's t-test. Four independent experiments showed the similar results. Bar: 10 μm.

Similar articles

Cited by

References

    1. Alcock J, Scotting P, Sottile V (2007) Bergmann glia as putative stem cells of the mature cerebellum. Med Hypotheses 69: 341–345 - PubMed
    1. Basco E, Hajos F, Fulop Z (1977) Proliferation of Bergmann-glia in the developing rat cerebellum. Anat Embryol (Berl) 151: 219–222 - PubMed
    1. Beausoleil SA, Jedrychowski M, Schwartz D, Elias JE, Villen J, Li J, Cohn MA, Cantley LC, Gygi SP (2004) Large-scale characterization of HeLa cell nuclear phosphoproteins. Proc Natl Acad Sci USA 101: 12130–12135 - PMC - PubMed
    1. Cao Y, Bonizzi G, Seagroves TN, Greten FR, Johnson R, Schmidt EV, Karin M (2001) IKKalpha provides an essential link between RANK signaling and cyclin D1 expression during mammary gland development. Cell 107: 763–775 - PubMed
    1. Ching YP, Qi Z, Wang JH (2000) Cloning of three novel neuronal Cdk5 activator binding proteins. Gene 242: 285–294 - PubMed

Publication types

MeSH terms