. 2010 Jul;137(13):2215-25.
doi: 10.1242/dev.046722.

Frizzled-5, a receptor for the synaptic organizer Wnt7a, regulates activity-mediated synaptogenesis

Affiliations

Frizzled-5, a receptor for the synaptic organizer Wnt7a, regulates activity-mediated synaptogenesis

Macarena Sahores et al. Development. 2010 Jul.

Abstract

Wnt proteins play a crucial role in several aspects of neuronal circuit formation. Wnts can signal through different receptors including Frizzled, Ryk and Ror2. In the hippocampus, Wnt7a stimulates the formation of synapses; however, its receptor remains poorly characterized. Here, we demonstrate that Frizzled-5 (Fz5) is expressed during the peak of synaptogenesis in the mouse hippocampus. Fz5 is present in synaptosomes and colocalizes with the pre- and postsynaptic markers vGlut1 and PSD-95. Expression of Fz5 during early stages of synaptogenesis increases the number of presynaptic sites in hippocampal neurons. Conversely, Fz5 knockdown or the soluble Fz5-CRD domain (Fz5CRD), which binds to Wnt7a, block the ability of Wnt7a to stimulate synaptogenesis. Increased neuronal activity induced by K+ depolarization or by high-frequency stimulation (HFS), known to induce synapse formation, raises the levels of Fz5 at the cell surface. Importantly, both stimuli increase the localization of Fz5 at synapses, an effect that is blocked by Wnt antagonists or Fz5CRD. Conversely, low-frequency stimulation, which reduces the number of synapses, decreases the levels of surface Fz5 and the percentage of synapses containing the receptor. Interestingly, Fz5CRD abolishes HFS-induced synapse formation. Our results indicate that Fz5 mediates the synaptogenic effect of Wnt7a and that its localization to synapses is regulated by neuronal activity, a process that depends on endogenous Wnts. These findings support a model where neuronal activity and Wnts increase the responsiveness of neurons to Wnt signalling by recruiting Fz5 receptor at synaptic sites.


Figures
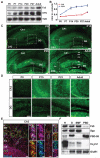
Fig. 1.
Fig. 1.
Localization of Fz5 in the mouse hippocampus at different developmental stages. (A) Representative blots from brain homogenates of P0, P7, P14, P20 and adult mice showing the expression levels of Fz5, synapsin I (SYN) and α-tubulin (TUB). (B) Fz5/α-tubulin and synapsin I/α-tubulin ratios as determined by densitometric analysis of mouse brain homogenates (n=3 brains for each age). (C) Expression pattern of Fz5 in the hippocampus of P0, P15, P23 and adult mice (n=3 brains for each stage). gr, granular cell layer of the dentate gyrus (DG); lm, stratum lacunosum moleculare; luc, stratum lucidum of CA3; mol, molecular layer of the DG; ori, stratum oriens; pol, polymorphic layer of the DG; pyr, pyramidal cell layer; rad, stratum radiatum. (D) Enlarged boxed areas from C. (E) (a) Maximal projection of confocal images obtained with the 3D feature of Volocity showing Fz5, vGlut1 and PSD-95 staining in the CA3 region of P15 mice (n=3 experiments). (b-e) Enlarged boxed area from a with different stainings as indicated in a. (f) Single confocal plane of a cell also present in a, showing the colocalization of Fz5 with vGlut1 and PSD-95. (g-j) Enlarged boxed area from f with different stainings as indicated in a. (F) Fz5 distribution in adult mouse brain homogenates (H), synaptosomes (S), the synaptosomal membrane fraction (SMF) and the PSD fraction (PSD. n=5 experiments. Synaptophysin (Syp) and PSD-95 are pre- and postsynaptic markers, respectively. N-type Ca2+ channel (Cav2.2) and GluR1 were used to show receptor distribution. Scale bars: 100 μm in C; 50 μm in D; 10 μm in Ea; 5 μm in Ef; 1 μm in Eb-d,g-j.
Fig. 2.
Fig. 2.
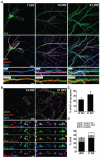
Fz5 distribution in cultured hippocampal neurons. (A) Expression of Fz5 in 7, 14 and 21 DIV cultured hippocampal neurons (n=3 experiments). Middle panels: Fz5 colocalization with MAP-2 and tubulin (Tuj1). Lower panels: enlarged boxed areas. (B) Representative images showing the colocalization of sFz5 with vGlut1 and NR1. Lower panels: enlarged boxed areas. (C) Percentage of sFz5 that colocalizes with both vGlut1 and NR1 in 14 and 21 DIV cultured neurons (n=3 experiments). (D) Percentage of sFz5 that colocalizes with both synaptic and extrasynaptic vGlut1 (grey) and NR1 (white) in 14 and 21 DIV neurons (n=3 experiments). Scale bars: 10 μm (top and middle panels) and 2 μm (lower panels) in A; 5 μm (upper panels) and 1 μm (lower panels) in B. *, P<0.05.
Fig. 3.
Fig. 3.
Fz5 stimulates the formation of presynaptic sites. (A) Representative images showing synapsin I puncta (SYN) in hippocampal neurons expressing EGFP or Fz5-HA. Lower panels: enlarged boxed areas. (B) Number of synapsin 1 clusters in hippocampal neurons expressing EGFP or Fz5-HA (n=4 experiments; 8-12 cells were used per condition for each experiment). (C) Microscopy images showing bassoon puncta (BSN) in hippocampal neurons expressing EGFP or Fz5-HA. Lower panels: enlarged boxed areas. (D) Number of bassoon puncta in cultured neurons expressing EGFP or Fz5-HA (n=4 experiments; 8-12 cells were used per condition for each experiment). Scale bars: 20 μm (upper panels) and 5 μm (lower panels) in A; 20 μm (upper panels) and 5 μm (lower panels) in C. *, P<0.05; **, P<0.01.
Fig. 4.
Fig. 4.
Fz5 promotes synapse formation by binding to Wnt7a. (A) Wnt7a-HA binding (dark precipitate, black arrows) to Fz5CRD-myc-GPI (white arrows) but not to Dfz2CRD-myc-GPI-expressing Cos-7 cells (n=3 experiments). Blue: Hoechst nuclei staining. (B) Synapsin I (SYN) and bassoon (BSN) clustering in cultured hippocampal neurons treated with Fz5CRD and/or Wnt7a. Tubulin: Tuj1. (C) Number of synapsin 1 clusters in hippocampal neurons treated with Fz5CRD and/or Wnt7a (n=3 experiments; 8-12 cells were used per condition for each experiment). EGFP-CM: conditioned medium from EFGP-transfected QT6 cells. (D) Bassoon cluster number in cultured neurons treated with Wnt7a and/or Fz5CRD (n=3 experiments; 8-12 cells were used per condition for each experiment). Scale bars: 20 μm in A,B. *, P<0.05; **, P<0.01; ***, P<0.001; ****, P<0.0001.
Fig. 5.
Fig. 5.
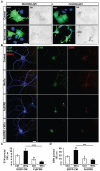
Fz5 knockdown abolishes Wnt7a-induced synapse formation. (A) Representative blots showing Fz5 and α-tubulin (TUB) protein levels in NRK cells transfected with shRNAs to Fz5 (n=3 experiments). nc-shRNA, negative control shRNA; shRNA 1 to 4, Fz5shRNAs; untransf, untransfected cells; Fz5-shRNAs, mixture of Fz5shRNAs. (B) Confocal images show Fz5 expression in NRK cells transfected with Fz5-shRNAs or nc-shRNAs (n=3 experiments). (C) Fz5 expression in cultured hippocampal neurons transfected with Fz5-shRNAs or nc-shRNA (n=3 experiments). Insets show an enlarged view of boxed areas. (D) Bassoon (BSN) puncta in cultured hippocampal neurons transfected with Fz5-shRNAs or nc-shRNAs and treated with Wnt7a. (E) Number of bassoon clusters in hippocampal neurons treated with Wnt7a and transfected with Fz5-shRNAs or nc-shRNAs (n=3 experiments; 8-12 cells were used per condition for each experiment). Scale bars: 10 μm; 5 μm in inset in C. *, P<0.05; ***, P<0.001; ****, P<0.0001.
Fig. 6.
Fig. 6.
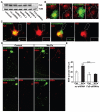
K+ depolarization increases Fz5 levels at the surface and at synapses. (A) Representative blots showing the effects of K+ depolarization on CaMKII phosphorylation in cultured hippocampal neurons. Upper panel: CaMKII phosphorylated on Thr286. Lower panel: total CaMKII. (B) pCaMKII/total CaMKII ratio in Na+ and K+-treated neurons as determined by densitometric analysis (n=3 experiments). (C) Levels of sFz5 following K+ depolarization. Upper panel: biotinylated sFz5. Middle panel: total Fz5. Lower panel: α-tubulin. (D) Surface Fz5/total Fz5 ratio used to determine the effect of K+ depolarization in cultured neurons (n=3 experiments). (E) Representative images showing the localization of sFz5, vGlut1 and NR1 following K+ depolarization. (F-I) Effects of K+ depolarization on the number (F), volume (G), intensity (H) and synaptic localization (I) of sFz5 puncta (n=3 experiments; 8-12 cells were used per condition for each experiment). Scale bar: 1 μm in E. *, P<0.05; **, P<0.01; ***, P<0.001.
Fig. 7.
Fig. 7.
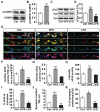
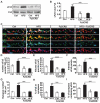
High-frequency stimulation and low-frequency stimulation have opposite effects on Fz5 levels at the surface and at synapses. (A) Effect of high-frequency stimulation (HFS) on CaMKII phosphorylation in cultured hippocampal neurons. Upper panel: CaMKII phosphorylated on Thr286. Lower panel: total CaMKII. (B) Quantification showing the level of phosphorylation of Thr286CaMKII after normalization to total CaMKII. (C) Surface Fz5 levels following HFS and low-frequency stimulation (LFS). sFz5, biotinylated sFz5; Fz5, total Fz5; Tub, α-tubulin. (D) Surface Fz5/total Fz5 ratio calculated to show the effects of HFS and LFS on Fz5 levels. (E) Representative images of sFz5, vGlut1 and NR1 staining following HFS and LFS. (F-I) Effects of HFS and LFS on the number (F), volume (G), intensity (H) and synaptic localization (I) of sFz5 puncta. (n=3 experiments; 8-12 cells were used per condition for each experiment). (J) Quantification of synapse number following HFS and LFS (n=3 experiments; 8-12 cells were used per condition for each experiment). (K) Percentage of synapses containing sFz5 after HFS and LFS (n=3 experiments; 8-12 cells were used per condition for each experiment). Scale bar: 2 μm in E. *, P<0.05; **, P<0.01; ***, P<0.001.
Fig. 8.
Fig. 8.
Fz5CRD abolishes the effect of HFS on the localization of Fz5 at the surface and the formation of synapses. (A) Representative blots showing the effect of Fz5CRD on sFz5 in stimulated and non-stimulated neurons. sFz5, biotinylated sFz5; Fz5; total Fz5. (B) Surface Fz5/total Fz5 ratio that shows sFz5 levels in stimulated or unstimulated cells incubated with Fz5CRD (n=3 experiments). (C) Unstimulated or HFS neurons incubated with Fz5CRD followed by staining for sFz5, vGlut1 and NR1. (D-F) Quantification showing the effect of Fz5CRD on the number (D), volume (E) and intensity (F) of sFz5 puncta in unstimulated or stimulated cells (n=3 experiments; 8-12 cells were used per condition for each experiment). (G-I) Effect of Fz5CRD on the total number of synapses (G), synaptic sFz5 (H) and percentage of synapses containing sFz5 (I) in unstimulated or stimulated cells (n=3 experiments; 8-12 cells were used per condition for each experiment). Scale bar: 1 μm in C. *, P<0.05; **, P<0.01; ***, P<0.001; ****, P<0.0001.
Fig. 9.
Fig. 9.
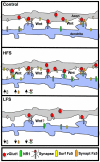
Regulation of sFz5 localization and synapse formation by neuronal activity and secreted Wnts. The insertion of Fz5 to synapses is differentially regulated by distinct temporal patterns of synaptic activation. LFS drives Fz5 out of synapses, whereas HFS, through a mechanism that involves secreted Wnts, increases the levels of Fz5 at the surface and at synaptic sites. In addition, Wnt-Fz5 signalling participates in the formation of new synapses induced by neuronal activity.

Similar articles

Cited by

References

    1. Ahmad-Annuar A., Ciani L., Simeonidis I., Herreros J., Fredj N. B., Rosso S. B., Hall A., Brickley S., Salinas P. C. (2006). Signaling across the synapse: a role for Wnt and Dishevelled in presynaptic assembly and neurotransmitter release. J. Cell Biol. 174, 127-139 - PMC - PubMed
    1. Angers S., Moon R. T. (2009). Proximal events in Wnt signal transduction. Nat. Rev. Mol. Cell Biol. 10, 468-477 - PubMed
    1. Antonova I., Arancio O., Trillat A. C., Wang H. G., Zablow L., Udo H., Kandel E. R., Hawkins R. D. (2001). Rapid increase in clusters of presynaptic proteins at onset of long-lasting potentiation. Science 294, 1547-1550 - PubMed
    1. Ataman B., Ashley J., Gorczyca M., Ramachandran P., Fouquet W., Sigrist S. J., Budnik V. (2008). Rapid activity-dependent modifications in synaptic structure and function require bidirectional Wnt signaling. Neuron 57, 705-718 - PMC - PubMed
    1. Attwell D., Laughlin S. B. (2001). An energy budget for signaling in the grey matter of the brain. J. Cereb. Blood Flow Metab. 21, 1133-1145 - PubMed

Publication types