. 2010 Jun 9;11(6):467-78.
doi: 10.1016/j.cmet.2010.04.005.

Defective hepatic autophagy in obesity promotes ER stress and causes insulin resistance

Affiliations

Defective hepatic autophagy in obesity promotes ER stress and causes insulin resistance

Ling Yang et al. Cell Metab. .

Abstract

Autophagy is a homeostatic process involved in the bulk degradation of cytoplasmic components, including damaged organelles and proteins. In both genetic and dietary models of obesity, we observed a severe downregulation of autophagy, particularly in Atg7 expression levels in liver. Suppression of Atg7 both in vitro and in vivo resulted in defective insulin signaling and elevated ER stress. In contrast, restoration of the Atg7 expression in liver resulted in dampened ER stress, enhanced hepatic insulin action, and systemic glucose tolerance in obese mice. The beneficial action of Atg7 restoration in obese mice could be completely prevented by blocking a downstream mediator, Atg5, supporting its dependence on autophagy in regulating insulin action. Our data demonstrate that autophagy is an important regulator of organelle function and insulin signaling and that loss of autophagy is a critical component of defective insulin action seen in obesity.


Figures

Figure 1
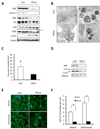
Figure 1. Regulation of autophagy in obesity
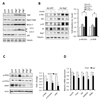
A. Autophagy and ER stress indicators were examined in liver tissue of obese (ob/ob) mice and age-and sex-matched lean controls by western blot analysis. Autophagy was evaluated by the conversion of LC3-I to LC3-II, expression of Beclin 1, Atg5, Atg7, and p62 proteins as markers. ER stress was examined by the phosphorylation of IRE1 and PERK (the arrow indicates phosphorylated PERK). B. Representative electron micrographs (9690×) of livers of lean and obese mice. The pictures shown on the right are high magnification (57800×) of the field marked with a red rectangle on the left panel. C. Quantification of autophagolysosome-like vacuoles per field in the EM images. D. Examination of autophagic markers in the liver of obese mice and its age-and sex-matched lean control after food withdrawal. E. Representative pictures of GFP-LC3 punctate structures in livers of lean and obese mice expressing GFP-LC3, in the presence or absence of chloroquine. The red arrows indicate the GFP-LC3 punctate structure; the nuclei were stained with DAPI shown in blue. F. Quantification of GFP-LC3 punctate structure per cell. Data are shown as mean ± SEM. Asterisk indicates statistical significance determined by student’s t test (*p<0.05). All mice are male and at the age of 12–16 weeks.
Figure 2
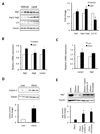
Figure 2. Regulation of Atg7 in liver of lean and obese mice
A. Autophagy was examined in livers of wild type lean mice (10 week-old) treated with lipid infusion or vehicle for 5 hrs, using Atg7, conjugated Atg5 and LC3 conversion as autophagy markers. Quantification is shown on the right side panel. B. mRNAs coding for Atg7, Atg5 and Lamp2 were examined by quantitative RT-PCR in livers of lean mice treated with vehicle (n=3) or lipid infusion (n=5) for 5 hrs. Results are presented as gene expression levels in lipid infusion group normalized to vehicle controls. C. mRNAs coding for Atg7, Lamp2 were examined by quantitative RT-PCR in livers of lean mice (n=3) or ob/ob mice. Results are presented as gene expression levels in obese group normalized to lean controls. D. Representative western blot of Calpain 2 expression in the livers of ob/ob mice (n=8) and lean mice (n=7) control. Quantification of the blots is shown on the bottom. E. ob/ob mice were injected with Calpain inhibitor III (10mg/kg), PD150606 (10mg/kg), and liver Atg7 expression was examined by western blot assay. Quantification of the blots is shown on bottom, with 4 mice in each treatment. All data are shown as mean±SEM. Asterisk indicates statistical significance determined by student’s t test (*p<0.05).
Figure 3
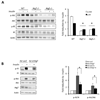
Figure 3. Suppression of autophagy results in impaired insulin signaling
A. Wild type (WT), Atg7−/− or Atg5−/− MEF cells were stimulated with 50nM insulin. Insulin receptor signaling was detected by western blot analysis of phosphorylation of IR tyrosine 1162/1163 (p-IR) and Akt serine 473 (p-Akt), with quantification shown on the right side panel. Results represent fold induction by insulin compared to basal levels in each group. B. Hepa1-6 cells were infected with adenovirus-mediated control shRNAi to LacZ (Ad-LacZ) or shRNAi to Atg7 (Ad-shAtg7) at a titer of 2×10⁹ vp/ml per well in 12-well plate. Forty-eight hours later, cells were stimulated with 10nM insulin (In) for 3 mins and the insulin receptor signaling was examined by western blot analysis. Quantification is shown on the right side panel. Results represent fold induction by insulin compared to basal levels in each group. Asterisk indicates statistical significance determined by student’s-t test (*p<0.05).
Figure 4
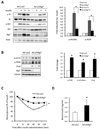
Figure 4. Defective autophagy results in insulin resistance
A. Hepatic insulin action in lean mice following in vivo Atg7 knock down with shRNAi. Lean mice (male, 14-week old, C57BL/6J) were injected with Ad-LacZ or Ad-shAtg7. Insulin signaling was examined in intact mice following hepatic insulin administration. Quantification of the data is shown on right panel with the averaged results of 4 mice in each treatment group. Results represent fold induction by insulin compared to basal levels in each group. Data are shown as mean±SEM. Asterisk indicates statistical significance determined by student’s-t test (*p<0.05). B. Examination of ER stress in livers of lean mice following Atg7 knock down in vivo. Chop, PERK and eIF2α phsophorylation were detected by western blot analysis and Atg7 and tubulin proteins are shown as controls. Quantification of the data shown on right panel. Results represent fold change in each molecule by Ad-shAtg7 to Ad-LacZ. C. Insulin tolerance test was performed in lean mice (n=8) following Atg7 knockdown (n=8). Results represent blood glucose concentrations relative to the starting value. All data are presented as mean±SEM, with statistical analysis performed by repeated measures two-way ANOVA followed by post-test (* indicates p<0.05). D. Serum insulin level was measured in lean mice after 6 hrs fasting following Atg7 knockdown.
Figure 5
Figure 5. Restoration of autophagy and improvement of insulin action by reconstitution of Atg7 in obese mice
A. Autophagy in ob/ob mice following adenoviral expression of Atg7 or control vector (GFP). Atg7, Atg12-Atg5 conjugation, Beclin 1 expression, LC3 conversion and p62 levels were examined as autophagy markers. B. Insulin-stimulated IR tyrosine 1162/1163 (p-IR) and Akt serine 473 (p-Akt) phosphorylationin the livers of ob/ob mice expressing Atg7 or control vector (GFP). Atg7 and tubulin are used as controls. Quantification of the data is shown in right panel. Results represent fold induction by insulin compared to basal levels in each group. C. Phosphorylation of PERK, eIF2α and expression of HERP proteins in the livers of ob/ob mice expressing Atg7 or control (GFP) proteins by adenoviral delivery. Actin is shown as a control and quantification of the data is shown in right panel. Results represent fold change in each molecule by Ad-Atg7 to Ad-GFP. D. mRNAs coding for Grp78, Chop, PDI, Gadd34 and ERdi4 were examined by quantitative RT-PCR in livers of ob/ob mice reconstituted with Atg7. Results are presented as gene expression levels in Atg7 group normalized to controls (GFP). All data are shown as mean±SEM. Asterisk indicates statistical significance determined by student’s t test (*p<0.05).
Figure 6
Figure 6. Metabolic effects of liver Atg7 restoration in obese mice
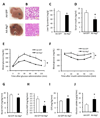
A. Gross anatomical views of representative livers of ob/ob mice expressing Atg7 (Ad-Atg7) or control vector (Ad-GFP). B. Representative images of H&E staining (40×) in ob/ob mice liver expressing Atg7 or control vector. Triglyceride (Tg) content of the liver (C), serum insulin level (D) were measured in ob/ob mice expressing Atg7 (n=8) or control vector (n=8). Data are shown as mean±SEM. Asterisk indicates statistical significance determined by student’s-t test (*p<0.05). E. Glucose tolerance test (GTT) performed in ob/ob mice following injection of Adeno-GFP (Ad-GFP, n=8) or Adeno-Atg7 (Ad-Atg7, n=8). F. Insulin tolerance test in ob/ob mice following injection of Ad-GFP or Ad-Atg7. All data are presented as mean±SEM, with statistical analysis performed by repeated measures two-way ANOVA (* indicates p<0.05). Hyperinsulinaemic–euglycaemic clamp studies were performed in ob/ob mice transduced with Ad-GFP (n = 7) or Ad-Atg7 (n = 6). Basal and clamp hepatic glucose production (HGP) (G–H), glucose infusion rate (GIR) (I) and glucose uptake in gastrocnemius muscle (J) were analyzed. Data are shown as the mean±SEM, *P < 0.05.
Figure 7
Figure 7. Autophagy-dependent regulation of systemic insulin action by Atg7 in obese mice
Glucose (A) and insulin (B) tolerance tests in ob/ob mice expressing dominant-negative Atg5 (DN-Atg5+GFP), Atg7 (Atg7+GFP), or combination (Atg7+Dn-Atg5). GFP virus alone is the control. Results represent blood glucose concentrations relative to the starting value. All data are presented as mean±SEM, with statistical analysis performed by repeated measures ANOVA followed by post test (* indicates p<0.05). Each group contained 8 mice at age of 9 weeks. C. Insulin-stimulated phosphorylation of IR tyrosine 1162/1163 (p-IR) and Akt serine 473 (p-Akt) in the livers of ob/ob mice expressing GFP, Atg7+GFP, DN-Atg5+GFP, or Atg7+DN-Atg5. Quantification of each molecule shown in panel C is on the right. Results represent fold induction by insulin compared to basal levels in each group of mice. Data are shown as mean±SEM. Asterisk indicates statistical significance determined by student’s-t test (*p<0.05).

Comment in

Similar articles

Cited by

References

    1. Axe EL, Walker SA, Manifava M, Chandra P, Roderick HL, Habermann A, Griffiths G, Ktistakis NT. Autophagosome formation from membrane compartments enriched in phosphatidylinositol 3-phosphate and dynamically connected to the endoplasmic reticulum. J Cell Biol. 2008;182:685–701. - PMC - PubMed
    1. Bernales S, Schuck S, Walter P. ER-phagy: selective autophagy of the endoplasmic reticulum. Autophagy. 2007;3:285–287. - PubMed
    1. Bjorkoy G, Lamark T, Brech A, Outzen H, Perander M, Overvatn A, Stenmark H, Johansen T. p62/SQSTM1 forms protein aggregates degraded by autophagy and has a protective effect on huntingtin-induced cell death. J Cell Biol 171. 2005:603–614. - PMC - PubMed
    1. Cao H, Gerhold K, Mayers JR, Wiest MM, Watkins SM, Hotamisligil GS. Identification of a lipokine, a lipid hormone linking adipose tissue to systemic metabolism. Cell. 2008;134:933–944. - PMC - PubMed
    1. Ding WX, Yin XM. Sorting, recognition and activation of the misfolded protein degradation pathways through macroautophagy and the proteasome. Autophagy. 2008;4:141–150. - PubMed

Publication types

Substances