. 2010 Jul 5;207(7):1351-8.
doi: 10.1084/jem.20100458. Epub 2010 May 31.

The miR-144/451 locus is required for erythroid homeostasis

Affiliations

The miR-144/451 locus is required for erythroid homeostasis

Kasper D Rasmussen et al. J Exp Med. .

Abstract

The process of erythropoiesis must be efficient and robust to supply the organism with red bloods cells both under condition of homeostasis and stress. The microRNA (miRNA) pathway was recently shown to regulate erythroid development. Here, we show that expression of the locus encoding miR-144 and miR-451 is strictly dependent on Argonaute 2 and is required for erythroid homeostasis. Mice deficient for the miR-144/451 cluster display a cell autonomous impairment of late erythroblast maturation, resulting in erythroid hyperplasia, splenomegaly, and a mild anemia. Analysis of gene expression profiles from wild-type and miR-144/451-deficient erythroblasts revealed that the miR-144/451 cluster acts as a "tuner" of gene expression, influencing the expression of many genes. MiR-451 imparts a greater impact on target gene expression than miR-144. Accordingly, mice deficient in miR-451 alone exhibited a phenotype indistinguishable from miR-144/451-deficient mice. Thus, the miR-144/451 cluster tunes gene expression to impart a robustness to erythropoiesis that is critical under conditions of stress.


Figures

Figure 1.
Figure 1.
Expression of miR-144/451 locus is dependent on Ago2 and restricted to the erythroid lineage. (A) The levels of miRNA expression in sorted Ago2fl/fl and Ago2−/− erythroblasts (Ter119hiCD71hi) were measured by miRNA array profiling. Graph shows expression, normalized to the housekeeping genes RNU6A, RNU6B, SNORD2, and SNORD3A, of miRNAs displaying >1.5-fold down-regulation in Ago2−/− erythroblasts. The mean and standard deviation from three independent experiments are shown. (B) Expression of miR-451 and miR-144 in erythroblasts was quantified by qRT-PCR and graphs show expression normalized to U6 snRNA. The mean and standard deviation of two independent measurements are shown. (C) Expression of miR-144 and miR-451 quantified by qRT-PCR in erythroid (E), lymphoid (B/T), and granulocyte/monocyte cells (G/M). The mean and standard deviation of two independent measurements are shown. (D) The spatial expression of miR-451 is shown by in situ hybridization on saggital sections of E16.5 dpc mouse embryos; hybridization with a control scrambled probe is also shown. Arrow indicates miR-451 expression in the fetal liver (FL). Representative images from one of three independent experiments are shown. (E) The expression of miR-451 and miR-144 was measured by Northern blotting of RNA derived from a fetal liver culture under conditions that promote proliferation (P) or differentiation. Numbers show hours in differentiation conditions. U6 snRNA was used as a loading control. The Northern was performed once from a representative fetal liver culture.
Figure 2.
Figure 2.
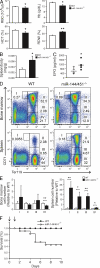
MiR-144/451 deficiency results in erythroid hyperplasia, ineffective erythropoiesis, and anemia. (A) MiR-144/451 deficiency alters several erythrocyte parameters in the peripheral blood. Bar graphs are shown expressing values for RBC, hemoglobin (Hb), hematocrit (HCT); and red cell distribution width (RDW). Bars represent mean values (n = 5), error bars indicate standard deviation. (B) Splenomegaly in miR-144/451−/− mice. Bars represent mean values (n = 5), error bars indicate standard deviation. (C) Erythropoietin (EPO) concentrations in plasma in miR-144/451−/− and wild-type littermate controls. The individual and mean EPO values are plotted for five independent measurements. (D) Representative FACS analysis of erythroid cell populations in the bone marrow and spleen of wild-type and miR-144/451−/− mice. Roman numerals and numbers indicate the identity and percentages of cells of the developmentally defined subpopulations (Socolovsky et al., 2001): I, proerythroblasts; II, basophilic erythroblasts; III, polychromatophilic erythroblasts; IV, orthochromatophilic erythroblasts. (E) Comparative enumeration of erythroid precursors in the bone marrow and spleen of miR-144/451−/− and wild-type mice. Numbers are expressed relative to the wild-type and plotted for the developmentally defined erythroid subpopulations indicated in D by roman numerals. The data in A, B, D, and E are representative of three independent experiments. (F) Survival plot of wild-type (n = 11) and miR-144/451−/− (n = 11) mice treated with phenylhydrazine. As indicated by the arrows, days 0 and 1 mark the days of the first and second injection, respectively. The data represent two independent experiments. *, P < 0.05; **, P < 0.0001.
Figure 3.
Figure 3.
MiR-144/451 is intrinsically required for terminal erythroid differentiation. (A) Cumulative growth curve (top) and the respective calculated doubling times (bottom) for wild-type and miR-144/451−/− fetal liver cells. The data are from biological triplicates and representative of two independent experiments. (B) Stacked column plot shows the number of cell divisions of wild-type and miR-144/451−/− fetal liver cells 48 h after the induction of terminal differentiation as determined by CFSE labeling. The data are representative of one experiment using biological triplicates. (C) Bar graphs show apoptotic fetal liver cells defined by Annexin V positivity in wild-type (n = 3) and miR-144/451−/− (n = 3) erythroid cultures at the indicated time points. Data represent mean values, error bars indicate standard deviation. No statistical differences were observed. The data are representative of two independent experiments. (D) The size distribution (FSC-A) of live fetal liver cells at the indicated time points during in vitro terminal differentiation as determined by FACS is shown for wild-type and miR-144/451−/− cultures. Representative plots of four independent experiments are shown. Independent measurements for D are already mentined. (E) Representative FACS analysis of erythroid cell populations in the in vitro fetal liver cultures at the indicated times (left). The gated small Vybrant violet-negative cells represent nascent reticulocytes. The graph depicts the mean number of reticulocytes as determined by FACS in wild-type and miR-144/451−/− differentiation cultures at the indicated times (right). Points represent mean values (n > 3), error bars indicate standard deviation. The data in D and E are representative of three independent experiments. *, P < 0.0001.
Figure 4.
Figure 4.
The miR-144/451 locus tunes the expression of many genes. (A) Expression scatterplot showing relative mean expression of Illumina probes in wild-type (x axis) and miR-144/451−/− (y axis) erythroblasts. Significantly up-regulated genes (red) and down-regulated genes (green) are shown. Expression profiling was performed once with biological quadruplicates of each genotype. (B) Sylamer enrichment landscape plot for all 876 7-nt motifs complementary to canonical mouse miRNA seed regions, either from nt 2–8 (7mer-m8) or from nt 1–7 (7mer-A1). The x axis represents the sorted gene list of 19,600 genes from most up-regulated to most down-regulated in the miR-144/451−/− erythroblasts. Each 7mer motif was tested for significant enrichment across the 3′ UTRs of genes in this list. The two motifs corresponding to seeds matching miR-451 (red, 7mer-m8; yellow, 7mer-A1) are enriched in the up-regulated genes, peaking at the most up-regulated 588 genes (solid vertical line). Two motifs matching the seed region of miR-144 (blue, 7mer-m8; light blue, 7mer-A1) are also significantly enriched, but to a lesser extent. The horizontal dotted lines represent a Bonferroni-corrected P value threshold of 0.05. (C) Upper region of an empirical cumulative density plot of log fold change for different populations of probes. Those probes whose 3′ UTRs possess miR-144 6-nt seed matches (green), miR-451 6-nt seeds (orange), or both seeds (red) are skewed toward higher positive fold changes in the miR-144/451−/− erythroblasts, compared with probes whose mapped 3′ UTRs do not contain a seed match (black). (D) qRT-PCR expression analysis of representative miR-144/451 seed-containing deregulated genes identified by Sylamer. Normalized data are plotted as relative fold change in miR-144/451−/− versus wild-type erythroblasts. Standard error is shown and * indicates significantly up-regulated expression (P < 0.05). Genes are color coded as in C. Data were obtained in two independent experiments measuring biological quadruplicates of each genotype.
Figure 5.
Figure 5.
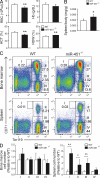
Selective disruption of miR-451 within the miR-144/451 locus results in erythroid hyperplasia, ineffective erythropoiesis, and anemia. (A) MiR-451 deficiency alters several erythrocyte parameters in the peripheral blood. Bar charts are shown expressing values for red blood cell (RBC) numbers, hemoglobin (Hb), hematocrit (HCT); and red cell distribution width (RDW). Bars represent mean values (n = 4), error bars indicate standard deviation. (B) Splenomegaly in miR-451−/− mice. Bars represent mean values (n = 4), error bars indicate standard deviation. (C) Representative FACS analysis of erythroid cell populations in the bone marrow and spleen of wild-type and miR-451−/− mice. (D) Comparative enumeration of erythroid precursors in the bone marrow and spleen of miR-451−/− and wild-type mice. For B and C, data are represented as in Fig. 2. *, P < 0.05; **, P < 0.01. The data in all panels are from biological quadruplicates and representative of two independent experiments.

Similar articles

Cited by

References

    1. Baek D., Villén J., Shin C., Camargo F.D., Gygi S.P., Bartel D.P. 2008. The impact of microRNAs on protein output. Nature. 455:64–71 10.1038/nature07242 - DOI - PMC - PubMed
    1. Bauer A., Tronche F., Wessely O., Kellendonk C., Reichardt H.M., Steinlein P., Schütz G., Beug H. 1999. The glucocorticoid receptor is required for stress erythropoiesis. Genes Dev. 13:2996–3002 10.1101/gad.13.22.2996 - DOI - PMC - PubMed
    1. Broudy V.C., Lin N.L., Priestley G.V., Nocka K., Wolf N.S. 1996. Interaction of stem cell factor and its receptor c-kit mediates lodgment and acute expansion of hematopoietic cells in the murine spleen. Blood. 88:75–81 - PubMed
    1. Bushati N., Cohen S.M. 2007. microRNA functions. Annu. Rev. Cell Dev. Biol. 23:175–205 10.1146/annurev.cellbio.23.090506.123406 - DOI - PubMed
    1. Cheloufi S., Dos Santos C.O., Chong M.M., Hannon G.J. 2010. A dicer-independent miRNA biogenesis pathway that requires Ago catalysis. Nature. 10.1038/nature09092 - DOI - PMC - PubMed

MeSH terms