. 2010 May 26;30(21):7377-91.
doi: 10.1523/JNEUROSCI.0924-10.2010.

Cysteine string protein-alpha prevents activity-dependent degeneration in GABAergic synapses

Affiliations

Cysteine string protein-alpha prevents activity-dependent degeneration in GABAergic synapses

Pablo García-Junco-Clemente et al. J Neurosci. .

Abstract

The continuous release of neurotransmitter could be seen to place a persistent burden on presynaptic proteins, one that could compromise nerve terminal function. This supposition and the molecular mechanisms that might protect highly active synapses merit investigation. In hippocampal cultures from knock-out mice lacking the presynaptic cochaperone cysteine string protein-alpha (CSP-alpha), we observe progressive degeneration of highly active synaptotagmin 2 (Syt2)-expressing GABAergic synapses, but surprisingly not of glutamatergic terminals. In CSP-alpha knock-out mice, synaptic degeneration of basket cell terminals occurs in vivo in the presence of normal glutamatergic synapses onto dentate gyrus granule cells. Consistent with this, in hippocampal cultures from these mice, the frequency of miniature IPSCs, caused by spontaneous GABA release, progressively declines, whereas the frequency of miniature excitatory AMPA receptor-mediated currents (mEPSCs), caused by spontaneous release of glutamate, is normal. However, the mEPSC amplitude progressively decreases. Remarkably, long-term block of glutamatergic transmission in cultures lacking CSP-alpha substantially rescues Syt2-expressing GABAergic synapses from neurodegeneration. These findings demonstrate that elevated neural activity increases synapse vulnerability and that CSP-alpha is essential to maintain presynaptic function under a physiologically high-activity regimen.


Figures
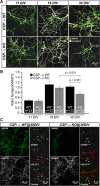
Figure 1.
Figure 1.
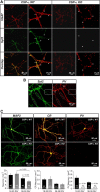
Progressive decrease in total synapse number in the absence of CSP-α. A, Confocal images of MAP2 (green) and synapsin (white) expression in WT and CSP-α KO neuronal cultures at three different time points. B, The synapsin/MAP2 ratio in CSP-α KO compared with WT cultures is only reduced at 30 DIV. Error bars indicate SEM. C, Confocal images of GABAergic (anti-GAD65; green; asterisks) and glutamatergic (anti-VGLUT1; white or red; arrowheads) synaptic puncta indicate a decreased proportion of GABAergic puncta in CSP-α KO cultures at 30 DIV.
Figure 2.
Figure 2.
Progressive reduction in GABAergic synaptic puncta of CSP-α KO hippocampal neuron cultures. Confocal images at two different magnifications of WT and CSP-α KO hippocampal neuron cultures at 11 DIV labeled with anti-synaptobrevin 2/VAMP2 (green; asterisks) and anti-VGAT (white and red) antibodies identify GABAergic synaptic puncta at colocalization points (arrowheads) that coexist with non-GABAergic puncta (asterisks). A, At 11 DIV, the percentage of GABAergic puncta is similar in WT and CSP-α KO cultures. B, At 30 DIV, the percentage of GABAergic puncta is significantly reduced in CSP-α KO (21.6%) compared with WT cultures (42.5%).
Figure 3.
Figure 3.
Ultrastructural analysis of GABAergic and glutamatergic synapses in culture. EM micrographs of glutamatergic and GABAergic synapses in WT (A–G) and KO (H–M) neuronal cultures. A–G, In the WT, GABAergic axon terminals (inh) establish inhibitory synapses with cell bodies (soma) and dendritic shafts (Den), and glutamatergic axon terminals (b) establish excitatory synapses with dendritic shafts (Den) and spines (s) of hippocampal neurons. H–M, In the KO, GABAergic (inh) and glutamatergic (exc) axon terminals were also detected, but the GABAergic axon terminals were generally smaller in size than those in the WT. Scale bars, 0.5 μm. The density of glutamatergic synapses did not change between WT and KO cultures, but there was a significant reduction in GABAergic synapses in the KO cultures (see Results).
Figure 4.
Figure 4.
Syt2-positive GABAergic synapses are strongly reduced in cultures lacking CSP-α. A, Confocal images at two different magnifications of hippocampal neuron cultures labeled with anti-VGAT (red) and anti-Syt2 (green) antibodies identify GABAergic synaptic puncta colocalizing (arrowheads) and not colocalizing (asterisks) with Syt2 in WT cultures. In CSP-α KO cultures, GABAergic puncta (asterisks), but not Syt2-positive puncta, are present. In WT cultures, the percentage of colocalized VGAT/Syt2-positive puncta at 30 DIV is 55.2 ± 2.7% (n = 4 cultures; 60 fields). In CSP-α KO cultures, Syt2-positive puncta is not detected (n = 4 cultures; 60 fields). B, Maximum projection of confocal images from WT neuron cultures showing Syt2- (green) and PV-positive puncta (red). Most of Syt2-positive puncta come from PV-positive neurons (dotted border rectangle), and only a few spots show no Syt2/PV colocalization (continuous border rectangle). That image is not representative and it was selected to show infrequent Syt2 synapses that do not colocalize with PV. C, Left, Stronger progressive decrease in the number of CSP-α KO neurons labeled with anti-MAP2 antibodies compared with WT (average density: 18–20 DIV WT, 15.3 ± 1.8 neurons/mm2, n = 2 cultures, 10 coverslips; KO, 16.6 ± 2.3 neurons/mm2, n = 2 cultures, 10 coverslips, nonsignificant differences; 36–39 DIV WT, 11.6 ± 1.3 neurons/mm2, n = 2 cultures, 12 coverslips; KO, 8.1 ± 1.0 neurons/mm2, n = 2 cultures, 12 coverslips; p = 0.045, Student's t test) and between KO cultures at different time points (p = 0.002, Student's t test). Middle, Similar progressive decrease in the number of WT and CSP-α KO neurons labeled with anti-CR antibodies (average density: 18–20 DIV WT, 2.1 ± 0.3 neurons/mm2, n = 2 cultures, 10 coverslips; KO, 2.2 ± 0.6 neurons/mm2, n = 2 cultures, 10 coverslips; 36–39 DIV WT, 1.1 ± 0.2 neurons/mm2, n = 2 cultures, 12 coverslips; KO, 1.0 ± 0.2 neurons/mm2, n = 2 cultures, 12 coverslips). Right, Progressive decrease in the number PV-expressing neurons in WT contrasts with no detection of PV-positive neurons in CSP-α KO cultures (average density in WT at 18–20 DIV: 0.6 ± 0.1 neurons/mm2, n = 3 cultures, 8 coverslips; 36–39 DIV: 0.4 ± 0.1 neurons/mm2, n = 3 cultures, 11 coverslips; p ≤ 0.001, Mann–Whitney rank sum test). Error bars indicate SEM.
Figure 5.
Figure 5.
Reduction in synaptic Syt2 and PV labeling and degeneration of basket cell terminals in CSP-α KO hippocampus. A, B, Confocal images from WT (A) and CSP-α KO (B) hippocampal slices labeled with anti-Syt2 (green) and anti-PV (red) antibodies. Stereological analysis shows no differences in the number of PV-positive somata (arrowheads) between the CSP-α WT and CSP-α KO hippocampus at P31–P40. However, note the different intensity in synaptic labeling (arrows) in the stratum pyramidale and granule cell layer. Syt2 staining also detected at the stratum lacunosum moleculare (dots). Labeling profiles through the z-axis demonstrate homogenous antibody penetration through the whole slice. C–D″, CA1 region in WT (C–C″) and KO (D–D″) hippocampal slices. Weaker Syt2 (green) and PV (red) labeling can be seen in the KO stratum pyramidale (asterisks). E–F″, Dentate gyrus in WT (E–E″) and KO (F–F″). There is a reduction in PV-positive puncta in the CSP-α KO (asterisks). Data from four WT and four KO littermates. G–L, EM analysis of excitatory (H, L) and inhibitory (G, I–K) synapses in the dentate gyrus. In the WT, GABAergic axon terminals (bt) (G) from basket cells establishing GABAergic synapses around the somata of granule cells (GC) are medium to large in size and are filled with synaptic vesicles. In the CSP-α KO mice (I–K), these terminals are smaller in size with less synaptic vesicles. In contrast, glutamatergic axon terminals (b) establishing excitatory synapses with dendritic shafts (Den) or spines (s) in the molecular layer of the dentate gyrus or close to the somatic inhibitory synapses are virtually similar in both WT (H) and CSP-α KO (L) mice. SO, Stratum oriens; SP, stratum pyramidale; SR, stratum radiatum; ML, molecular layer; GCL, granule cell layer.
Figure 6.
Figure 6.
Postnatal decrease in Syt2 and PV hippocampal protein levels in CSP-α KO mice. A, Representative immunoblots of hippocampal proteins from WT and CSP-α KO mice at P16, P20, P28, and P32 labeled with antibodies against CSP-α, Hsc70, Syt2, PV, synaptobrevin 2/VAMP2 (Syb2), synaptotagmin 1 (Syt1), and α-actin. B, Normalized protein levels assessed by measurement of direct chemiluminescence and relative to α-actin levels. Data are plotted as mean ± SEM; n = 4 for each genotype and for each marker; statistical significance was determined by Student's t test.
Figure 7.
Figure 7.
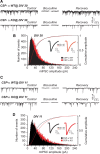
Decrease in mIPSC frequency, but not amplitude, in CSP-α KO hippocampal cultures at 30 DIV. A, C, mIPSCs in WT and KO neuron cultures at 30 and 11 DIV; bicuculline reversibly abolishes the mIPSCs. B, Histogram and cumulative distributions of mIPSC amplitudes from WT and KO hippocampal neuron cultures at 30 DIV. Inset, Average mIPSC traces for both genotypes. D, Histograms and cumulative distributions of mIPSC amplitudes from WT and KO hippocampal neuron cultures at 11 DIV. Inset, Average mIPSC traces for both genotypes.
Figure 8.
Figure 8.
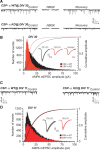
Downscaling of AMPAR-mediated mEPSCs in long-term CSP-α KO hippocampal cultures. A, Normal frequency of AMPAR-mediated mEPSCs in CSP-α KO cultures compared with WT at 30 DIV. NBQX reversibly blocks AMPAR mEPSCs. B, Strong reduction in the size of AMPAR-mediated mEPSCs in CSP-α KO cultures at 30 DIV. Histograms and cumulative distributions of amplitudes for both genotypes (error bars indicate SEM). Inset, Averaged AMPAR mEPSC waveforms for both genotypes and overlaid normalized KO response show no kinetic differences. C, Normal frequency of AMPAR-mediated mEPSCs for both genotypes at 11 DIV. D, Histograms and cumulative distributions of amplitudes for both genotypes show similar size of AMPAR-mediated mEPSCs in CSP-α KO and WT cultures at 11 DIV. Inset, Averaged AMPAR mEPSC waveforms for both genotypes (error bars indicate SEM).
Figure 9.
Figure 9.
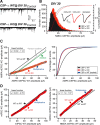
Multiplicative downscaling of AMPAR mEPSCs in the absence of CSP-α. A, NMDAR mEPSCs in WT and CSP-α KO neuronal cultures at 30 DIV. B, Histograms and cumulative distributions of NMDAR mEPSC amplitudes from WT and KO cultures at 30 DIV. Inset, Average NMDAR mEPSC traces for both genotypes and overlaid normalized response. C, Left, Ranked control AMPAR mEPSC amplitudes plotted against ranked CSP-α KO AMPAR mEPSC amplitudes. The best fit to the data of additive, random additive, or multiplicative functions was defined. Best fit: KO = WT × 0.43 − 1.14 (multiplicative function). Right, Cumulative amplitude histograms for WT and KO AMPAR mEPSCs. WT distribution was transformed according to the preceding multiplicative function and plotted together with the KO data. D, Left, Ranked control mIPSC amplitudes plotted against ranked KO mIPSC amplitudes. The best fit to the data was a multiplicative function with slope of 0.97 (KO = WT × 0.97 − 2.78). Right, Similar plot for comparison of WT and KO NMDAR mEPSC amplitudes. Best fit: KO = WT × 1.1 + 1.57 (multiplicative function). Slopes close to 1 indicate no size escalation of mIPSCs and NMDAR-mEPSCs in CSP-α KO cultures.
Figure 10.
Figure 10.
Recovery of GABAergic synaptic puncta in cultures lacking CSP-α after long-term blocking of glutamatergic synaptic transmission. A, Confocal images of synaptobrevin 2/VAMP2 and VGAT presynaptic staining of WT and KO neuronal cultures at 30 DIV after 3 weeks of glutamatergic transmission blockade. B, Recovery of Syt2 synaptic labeling at 30 DIV after glutamatergic blocking in KO cultures (n = 3 cultures). The right panels show magnification of selected areas from left panels, except for panel CSP-α (control), in which a bright-field image of the right panel demonstrates the presence of nonlabeled neurons.

Similar articles

Cited by

References

    1. Baumert M, Maycox PR, Navone F, De Camilli P, Jahn R. Synaptobrevin: an integral membrane protein of 18,000 daltons present in small synaptic vesicles of rat brain. EMBO J. 1989;8:379–384. - PMC - PubMed
    1. Chandra S, Gallardo G, Fernández-Chacón R, Schlüter OM, Südhof TC. Alpha-synuclein cooperates with CSPalpha in preventing neurodegeneration. Cell. 2005;123:383–396. - PubMed
    1. Clements JD, Bekkers JM. Detection of spontaneous synaptic events with an optimally scaled template. Biophys J. 1997;73:220–229. - PMC - PubMed
    1. Craig AM, Blackstone CD, Huganir RL, Banker G. The distribution of glutamate receptors in cultured rat hippocampal neurons: postsynaptic clustering of AMPA-selective subunits. Neuron. 1993;10:1055–1068. - PubMed
    1. Csicsvari J, Hirase H, Czurkó A, Mamiya A, Buzsáki G. Oscillatory coupling of hippocampal pyramidal cells and interneurons in the behaving rat. J Neurosci. 1999;19:274–287. - PMC - PubMed

Publication types

MeSH terms

LinkOut - more resources