. 2010 May 31;189(5):843-58.
doi: 10.1083/jcb.201003055. Epub 2010 May 24.

Regulation of O-glycosylation through Golgi-to-ER relocation of initiation enzymes

Affiliations

Regulation of O-glycosylation through Golgi-to-ER relocation of initiation enzymes

David J Gill et al. J Cell Biol. .

Abstract

After growth factor stimulation, kinases are activated to regulate multiple aspects of cell physiology. Activated Src is present on Golgi membranes, but its function here remains unclear. We find that Src regulates mucin-type protein O-glycosylation through redistribution of the initiating enzymes, polypeptide N-acetylgalactosaminyl transferases (GalNac-Ts), from the Golgi to the ER. Redistribution occurs after stimulation with EGF or PDGF in a Src-dependent manner and in cells with constitutively elevated Src activity. All GalNac-T family enzymes tested are affected, whereas multiple other glycosylation enzymes are not displaced from the Golgi. Upon Src activation, the COP-I coat is also redistributed in punctate structures that colocalize with GalNac-Ts and a dominant-negative Arf1 isoform, Arf1(Q71L), efficiently blocks GalNac-T redistribution, indicating that Src activates a COP-I-dependent trafficking event. Finally, Src activation increases O-glycosylation initiation as seen by lectin staining and metabolic labeling. We propose that growth factor stimulation regulates O-glycosylation initiation in a Src-dependent fashion by GalNac-T redistribution to the ER.


Figures
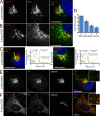
Figure 1.
Figure 1.
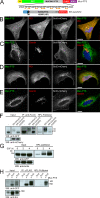
Growth factor stimulation effect on O-glycosylation marker distribution. (A and B) Helix pomatia lectin (HPL) staining at the Golgi (Giantin) in unstimulated HeLa cells (A) is redistributed out of the Golgi after EGF treatment (100 ng/ml) for 4 h (B). (C) HPL staining at the Golgi or neighboring cytoplasm is measured to quantify the fold enrichment at the Golgi. (D) HPL enrichment at the Golgi progressively decreases with increased EGF stimulation. 30 cells were quantified for each sample. Error bars show SEM. Statistical significance (p) measured by two-tailed paired t test. *, P <0.001 relative to mean HPL staining in unstimulated cells (0 h). This is a representative example from three independent experiments. (E and F) Anti-Tn staining colocalizes with HPL at the Golgi in unstimulated HeLa cells (E) or away from the Golgi in punctate cytoplasmic structures after EGF treatment for 4 h (F). In all images nuclei were stained using Hoechst and colored blue. Bar, 10 µm.
Figure 2.
Figure 2.
Src activation redistributes GalNac-T1 from the Golgi. (A and B) GalNac-T1 and HPL staining colocalizes only at the Golgi (Giantin) in unstimulated HeLa cells (A) but also in punctate cytoplasmic structures after EGF treatment (100 ng/ml) for 4 h (B). (C) The amount of GalNac-T1 staining colocalizing with Golgi membranes was compared between unstimulated HeLa cells and 4 h EGF-treated HeLa cells using fixed laser power and detector voltages. (D) Quantification of GalNac-T1 and HPL enrichment at the Golgi in HeLa cells treated with EGF for indicated times. 30 cells were quantified for each sample. Error bars show SEM. Statistical significance (p) measured by two-tailed paired t test. * and **, P < 0.001 relative to mean HPL or GalNac-T1 staining, respectively, in unstimulated cells (0 h). This is a representative example from three independent experiments. In all images nuclei were stained using Hoechst and colored blue. Bar, 10 µm.
Figure 3.
Figure 3.
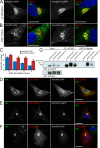
Redistribution of GalNac-Ts from the Golgi is dependent on Src activity levels. (A) HPL staining redistributed out of the Golgi (Giantin) in HeLa cells upon EGF stimulation (100 ng/ml) for 4 h is inhibited with cotreatment of 10 µM Src kinase inhibitors SKI and SU6656. (B) Quantification of HPL enrichment at the Golgi in HeLa cells cotreated with EGF and either DMSO or 10 µM Src inhibitors (SKI, SU6656) for indicated times. 30 cells were quantified for each sample. Error bars show SEM. Statistical significance (p) measured by two-tailed paired t test. * or **, P < 0.001 or P < 0.05, respectively, relative to mean HPL staining in DMSO-treated cells at each time point. This is a representative example from two independent experiments. (C) Quantification of HPL enrichment at the Golgi in HeLa cells cotreated with PDGF (50 ng/ml) and either DMSO or 10 µM SKI for indicated times. 30 cells were quantified for each sample. Error bars show SEM. Statistical significance (p) measured by two-tailed paired t test. *, P < 0.001 relative to mean HPL staining in DMSO-treated cells at each time point. This is a representative example from two independent experiments. (D) Low resolution immunofluorescence studies of HPL staining highlighting a reticulated network only in Src-activated SYFsrc fibroblasts and not Src-deficient SYF fibroblasts. (E) High resolution immunofluorescence studies of HPL and Mannosidase II staining in Src-deficient SYF and Src-activated SYFsrc fibroblasts. In all images nuclei were stained using Hoechst and colored blue. Bars: (A and E) 10 µm; (D) 50 µm.
Figure 4.
Figure 4.
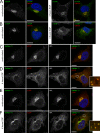
GalNac-Ts are trafficked to ERGIC and ER compartments upon Src activation. (A) GalNac-T1 and ERGIC53 staining colocalizes moderately only at the Golgi apparatus (Giantin) in unstimulated HeLa cells. (B) GalNac-T1 and ERGIC53 staining colocalizes in novel punctate ER-to-Golgi intermediate compartment (ERGIC) structures upon EGF treatment (100 ng/ml) for 4 h. These structures stain positively for HPL. (C) HPL staining is present exclusively at the Golgi with no significant colocalization with ER marker (PDI) in unstimulated HeLa cells. (D) HPL staining is present in diffuse structures that stained with an ER marker (PDI) upon EGF treatment for 4 h. In all images nuclei were stained using Hoechst and colored blue. Bar, 10 µm.
Figure 5.
Figure 5.
An ER-trapped GalNac-T activity reporter demonstrates that GalNac-Ts are active in the ER upon Src-induced redistribution. (A) Schematic of Muc-PTS GalNac-T activity reporter. (B and C) Immunofluorescence studies of Muc-PTS cotransfected in HeLa cells with inactive Src (SrcK-mCherry, containing K295M mutation) and staining with ER (PDI) (B) or Golgi (Giantin) (C) markers. (D and E) Immunofluorescence studies of Muc-PTS cotransfected in HeLa cells with active Src (SrcE-mCherry, containing E378G mutation) and staining with ER (D) or Golgi (E) markers. (F) SDS-PAGE analysis of Muc-PTS expressed alone in HEK293T cells or cotransfected with active (ER-GALNT2) or inactive (ER-GALNT2(H226D)) ER-targeted GalNac-T2. Muc-PTS was either immunoprecipitated with an anti-FLAG antibody or pulled down using HPL-conjugated agarose. (G) SDS-PAGE analysis of Muc-PTS pulled down using HPL-conjugated agarose after expression in HEK293T cells and treatment with EGF (100 ng/ml) for indicated times. (H) SDS-PAGE analysis of Muc-PTS coexpressed in HEK293T cells with either inactive Src (SrcK) or active SrcE (SrcE). Muc-PTS was either immunoprecipitated with an anti-FLAG antibody or pulled down using HPL-conjugated agarose. In all images nuclei were stained using Hoechst and colored blue. Bar, 10 µm.
Figure 6.
Figure 6.
Upon EGF stimulation, COP-I β1 and γ1 subunits are redistributed from the Golgi into punctate structures that also contain GalNac-T1. (A and B) COP-I β1 (A) and γ1 (B) staining at the Golgi (Giantin) in unstimulated HeLa cells (left panels) become redistributed out of the Golgi after EGF treatment (100 ng/ml) for 4 h (right panels). The increase in number and intensity of punctate cytoplasmic COP-I–stained structures suggests that the rate of COP-I trafficking is significantly increased. (C–F) GalNac-T1 staining colocalizes with the β1 (C) or γ1 (E) COP-I subunit exclusively at the Golgi (HPL) in unstimulated HeLa cells, but also in dispersed punctate structures that stain positive for β1 (D) or γ1 (F) COP-I after EGF treatment for 4 h. In all images nuclei were stained using Hoechst and colored blue. Bar, 10 µm.
Figure 7.
Figure 7.
A dominant-negative Arf(Q71L) mutant prevents redistribution of GalNac-Ts induced by Src activation. (A) Wild-type Arf1-GFP (Arf1(WT)-GFP) and mutant Arf1(Q71L)-GFP colocalize primarily at the Golgi (Giantin) in unstimulated HeLa cells. (B) Expression of mutant Arf1(Q71L)-GFP (right panels) but not Arf1(WT)-GFP (left panels) resists redistribution of GalNac-Ts (indicated by HPL staining) from the Golgi to the ER under EGF treatment (100 ng/ml) for 4 h. The amount of Arf1(WT)-GFP (left panels) but not Arf1(Q71L)-GFP (right panels) at the Golgi is significantly decreased after EGF stimulation. (C) Quantification of HPL enrichment at the Golgi in HeLa cells expressing either Arf1(WT)-GFP or mutant Arf1(Q71L)-GFP after EGF treatment for indicated times. 30 cells were quantified for each sample. Error bars show SEM. Statistical significance (p) measured by two-tailed t test. * and **, P < 0.05 or P < 0.001, respectively, relative to mean HPL staining in cells expressing Arf1(WT)-GFP at each time point. This is a representative example from two independent experiments. (D and E) Expression of mutant Arf1(Q71L)-GFP (D) but not Arf1(WT)-GFP (E) blocks redistribution of GalNac-Ts (indicated by HPL staining) under cotransfection with active Src (SrcE-DsRed) in Src-deficient SYF fibroblasts. Active Src is enriched at the Golgi only upon expression of Arf1(Q71L)-GFP (E) and not Arf1(WT)-GFP (D). (F) Co-expression of Arf1(WT)-GFP and inactive Src (SrcK-DsRed) in Src-deficient SYF fibroblasts does not induce trafficking of GalNac-Ts from the Golgi (indicated by normal HPL staining). In addition, inactive Src is highly enriched at the Golgi. (G) SDS-PAGE analysis of ER-trapped Muc-PTS GalNac-T activity reporter coexpressed in HEK293T cells with either inactive Src (SrcK) or active Src (SrcE) and Arf1(WT) or Arf1(Q71L). Muc-PTS was either immunoprecipitated with an anti-FLAG antibody or pulled down using HPL-conjugated agarose. In all images nuclei were stained using Hoechst and colored blue. Bars: (A–C) 10 µm; (D–F) 20 µm.
Figure 8.
Figure 8.
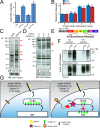
Src activity increases O-glycosylation initiation efficiency. (A) Quantification of total cellular HPL staining in model Src fibroblasts using a high throughput confocal microscope. At least 200 cells per well and three wells per cell line were quantified. Error bars show SEM. Statistical significance (p) was measured using a two-tailed paired t test. * and **, P < 0.001 relative to the mean HPL intensity in SYF and NIH3T3-WT cells, respectively. Normalization of SYFsrc and NIH3T3-vsrc HPL intensities was performed relative to SYF and NIH3T3-WT cell mean HPL intensities, respectively. This is a representative example from two independent experiments. (B) Quantification of total cellular HPL staining in HeLa cells treated with EGF (100 ng/ml) or PDGF (50 ng/ml) for indicated times using a high throughput confocal microscope. At least 200 cells per well and three wells per sample were quantified. Error bars show SEM. Statistical significance (p) was measured using a two-tailed paired t test. * and **, P < 0.001 relative to the mean HPL intensity in untreated cells for EGF and PDGF samples, respectively. This is a representative example from two independent experiments. (C) SDS-PAGE analysis of SYF and SYFsrc cell lysate metabolically labeled using GalNAz-FLAG. (D) SDS-PAGE analysis of unstimulated and EGF-treated HeLa cells metabolically labeled using GalNAz-FLAG for the indicated times. (E) Schematic of the Muc1-TR6 secreted O-glycosylation reporter. (F) SDS-PAGE analysis of secreted Muc1-TR6 purified using either agarose-conjugated Ni-NTA or HPL before labeling with GalNAz-FLAG. (G) A model for Src-induced Golgi-to-ER retrograde trafficking of GalNac-T enzymes. Under normal cellular conditions, GalNac-Ts are predominantly localized to the cis-face of the Golgi apparatus and initiation of O-glycosylation occurs in the Golgi apparatus. Upon activation of Src, GalNac-Ts are selectively trafficked to the ER. This increases the efficiency of O-glycosylation initiation and results in a greater density of GalNAc added onto mucin-like proteins (further O-glycan modifications are not included for sake of clarity).

Comment in

Similar articles

Cited by

References

    1. Bard F., Malhotra V. 2006. The formation of TGN-to-plasma-membrane transport carriers. Annu. Rev. Cell Dev. Biol. 22:439–455 10.1146/annurev.cellbio.21.012704.133126 - DOI - PubMed
    1. Bard F., Patel U., Levy J.B., Jurdic P., Horne W.C., Baron R. 2002. Molecular complexes that contain both c-Cbl and c-Src associate with Golgi membranes. Eur. J. Cell Biol. 81:26–35 10.1078/0171-9335-00217 - DOI - PubMed
    1. Bard F., Mazelin L., Péchoux-Longin C., Malhotra V., Jurdic P. 2003. Src regulates Golgi structure and KDEL receptor-dependent retrograde transport to the endoplasmic reticulum. J. Biol. Chem. 278:46601–46606 10.1074/jbc.M302221200 - DOI - PubMed
    1. Bisel B., Wang Y., Wei J.H., Xiang Y., Tang D., Miron-Mendoza M., Yoshimura S., Nakamura N., Seemann J. 2008. ERK regulates Golgi and centrosome orientation towards the leading edge through GRASP65. J. Cell Biol. 182:837–843 10.1083/jcb.200805045 - DOI - PMC - PubMed
    1. Bossard C., Bresson D., Polishchuk R.S., Malhotra V. 2007. Dimeric PKD regulates membrane fission to form transport carriers at the TGN. J. Cell Biol. 179:1123–1131 10.1083/jcb.200703166 - DOI - PMC - PubMed

Publication types

MeSH terms