

Signalling ballet in space and time
- PMID: 20495582
- PMCID: PMC2977972
- DOI: 10.1038/nrm2901
Signalling ballet in space and time
Abstract
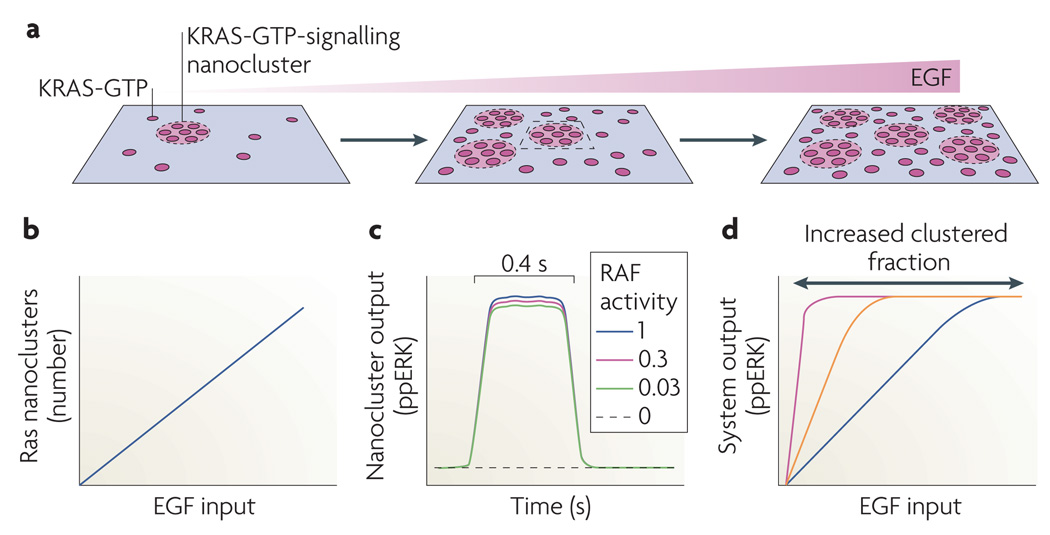
Although we have amassed extensive catalogues of signalling network components, our understanding of the spatiotemporal control of emergent network structures has lagged behind. Dynamic behaviour is starting to be explored throughout the genome, but analysis of spatial behaviours is still confined to individual proteins. The challenge is to reveal how cells integrate temporal and spatial information to determine specific biological functions. Key findings are the discovery of molecular signalling machines such as Ras nanoclusters, spatial activity gradients and flexible network circuitries that involve transcriptional feedback. They reveal design principles of spatiotemporal organization that are crucial for network function and cell fate decisions.
Figures
Similar articles
-
Highly efficient intracellular transduction in three-dimensional gradients for programming cell fate.Acta Biomater. 2016 Sep 1;41:181-92. doi: 10.1016/j.actbio.2016.06.004. Epub 2016 Jun 3. Acta Biomater. 2016. PMID: 27265151
-
Dynamic signal encoding--from cells to organisms.Semin Cell Dev Biol. 2014 Oct;34:91-8. doi: 10.1016/j.semcdb.2014.06.019. Epub 2014 Jul 5. Semin Cell Dev Biol. 2014. PMID: 25008461 Review.
-
Ras nanoclusters: Versatile lipid-based signaling platforms.Biochim Biophys Acta. 2015 Apr;1853(4):841-9. doi: 10.1016/j.bbamcr.2014.09.008. Epub 2014 Sep 16. Biochim Biophys Acta. 2015. PMID: 25234412 Review.
-
Single-cell Transcriptome Profiling reveals Dermal and Epithelial cell fate decisions during Embryonic Hair Follicle Development.Theranostics. 2020 Jun 12;10(17):7581-7598. doi: 10.7150/thno.44306. eCollection 2020. Theranostics. 2020. PMID: 32685006 Free PMC article.
-
[Some principles in the organization of cellular signaling systems: is genome an instructor or a performer?].Vestn Ross Akad Med Nauk. 2001;(10):8-18. Vestn Ross Akad Med Nauk. 2001. PMID: 12216463 Review. Russian.
Cited by
-
Dual specificity phosphatases 10 and 16 are positive regulators of EGF-stimulated ERK activity: indirect regulation of ERK signals by JNK/p38 selective MAPK phosphatases.Cell Signal. 2012 May;24(5):1002-11. doi: 10.1016/j.cellsig.2011.12.021. Epub 2012 Jan 3. Cell Signal. 2012. PMID: 22245064 Free PMC article.
-
G-protein signaling leverages subunit-dependent membrane affinity to differentially control βγ translocation to intracellular membranes.Proc Natl Acad Sci U S A. 2012 Dec 18;109(51):E3568-77. doi: 10.1073/pnas.1205345109. Epub 2012 Dec 3. Proc Natl Acad Sci U S A. 2012. PMID: 23213235 Free PMC article.
-
Spatiotemporal control of microtubule nucleation and assembly using magnetic nanoparticles.Nat Nanotechnol. 2013 Mar;8(3):199-205. doi: 10.1038/nnano.2012.246. Epub 2013 Jan 20. Nat Nanotechnol. 2013. PMID: 23334169
-
An investigation of spatial signal transduction in cellular networks.BMC Syst Biol. 2012 Jul 5;6:83. doi: 10.1186/1752-0509-6-83. BMC Syst Biol. 2012. PMID: 22765014 Free PMC article.
-
Protein logic: a statistical mechanical study of signal integration at the single-molecule level.Biophys J. 2012 Sep 5;103(5):1097-107. doi: 10.1016/j.bpj.2012.07.040. Biophys J. 2012. PMID: 23009860 Free PMC article.
References
-
-
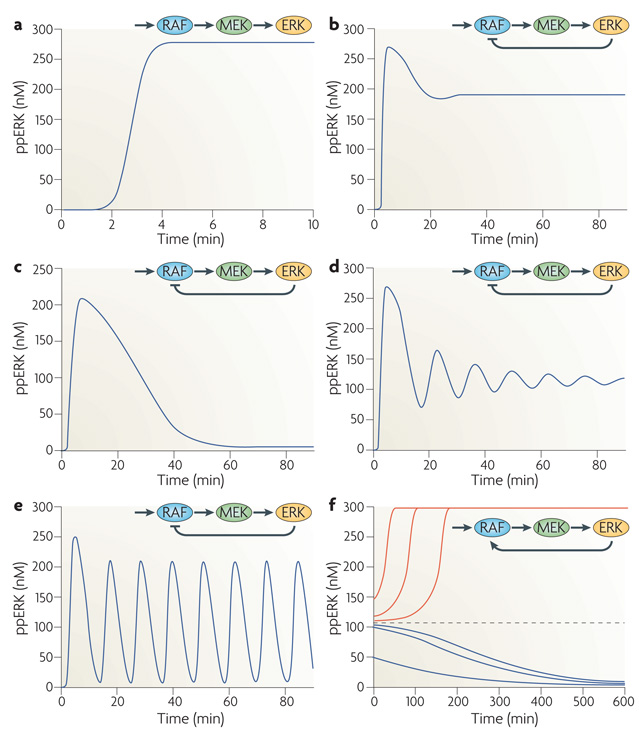
Marshall CJ. Specificity of receptor tyrosine kinase signaling: transient versus sustained extracellular signal-regulated kinase activation. Cell. 1995;80:179–185. A conceptual breakthrough summarizing many experimental observations that different durations of ERK activity can result in different phenotypic responses.
-
-
-
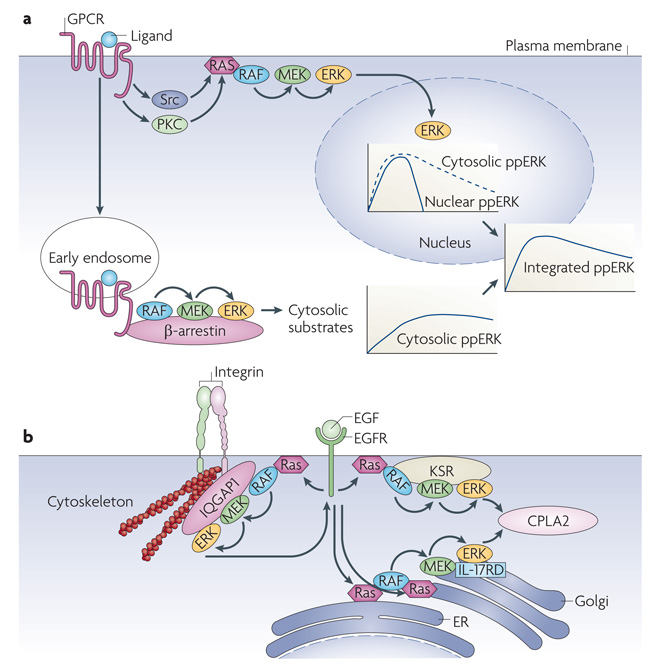
von Kriegsheim A, et al. Cell fate decisions are specified by the dynamic ERK interactome. Nature Cell Biol. 2009;11:1458–1464. Provides insight into a full set of protein–protein interactions involving ERK, and shows how ERK partners control ERK spatiotemporal dynamics and cell decisions.
-
-
- Meloche S, Pouyssegur J. The ERK1/2 mitogen-activated protein kinase pathway as a master regulator of the G1- to S-phase transition. Oncogene. 2007;26:3227–3239. - PubMed
Publication types
MeSH terms
Grants and funding
LinkOut - more resources
Full Text Sources
Other Literature Sources
