. 2010 Jul;11(7):608-17.
doi: 10.1038/ni.1883. Epub 2010 May 23.

The T helper type 2 response to cysteine proteases requires dendritic cell-basophil cooperation via ROS-mediated signaling

Affiliations

The T helper type 2 response to cysteine proteases requires dendritic cell-basophil cooperation via ROS-mediated signaling

Hua Tang et al. Nat Immunol. 2010 Jul.

Abstract

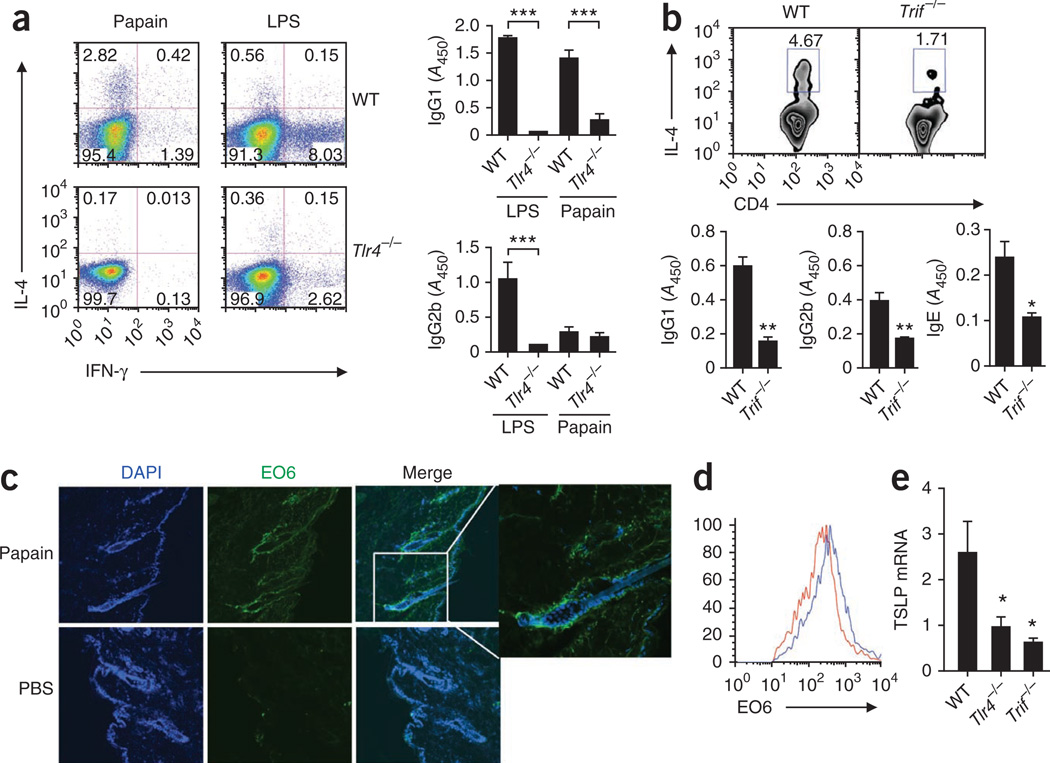
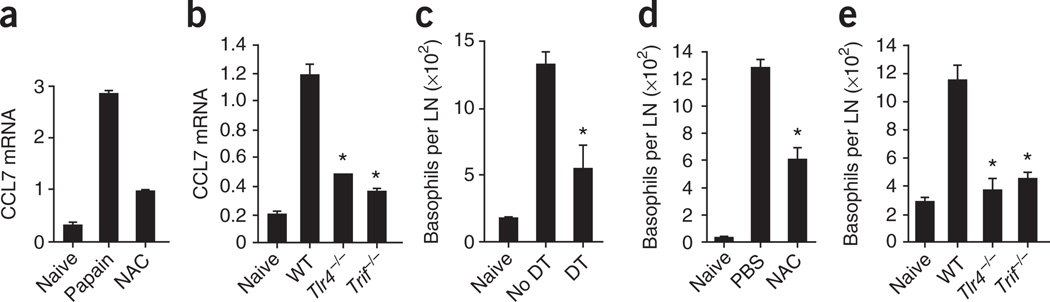
The mechanisms that initiate T helper type 2 (T(H)2) responses are poorly understood. Here we demonstrate that cysteine protease-induced T(H)2 responses occur via 'cooperation' between migratory dermal dendritic cells (DCs) and basophils positive for interleukin 4 (IL-4). Subcutaneous immunization with papain plus antigen induced reactive oxygen species (ROS) in lymph node DCs and in dermal DCs and epithelial cells of the skin. ROS orchestrated T(H)2 responses by inducing oxidized lipids that triggered the induction of thymic stromal lymphopoietin (TSLP) by epithelial cells mediated by Toll-like receptor 4 (TLR4) and the adaptor protein TRIF; by suppressing production of the T(H)1-inducing molecules IL-12 and CD70 in lymph node DCs; and by inducing the DC-derived chemokine CCL7, which mediated recruitment of IL-4(+) basophils to the lymph node. Thus, the T(H)2 response to cysteine proteases requires DC-basophil cooperation via ROS-mediated signaling.


Figures

Figure 1
Figure 1
Vital role of DCs in papain-induced TH2 responses. (a) Intracellular staining of IL-4 and IFN-γ in CD4+ T cells (left; day 21) and anti-OVA IgE, IgG1 and IgG2b in serum (right; day 21) from mice immunized on days 0, 7 and 14 with CpG or papain. A450, absorbance at 450 nm. (b) Intracellular staining of IFN-γ and IL-4 in CD4+ T cells from DC-depleted wild-type (WT) and CD11c-DTR mice immunized 4 d earlier with OVA plus papain. Numbers in quadrants (a,b) indicate percent cells in each. (c) ELISA of IL-4 in supernatants of draining lymph node cells from wild-type or CD11c-DTR mice given various numbers of CD4+ OT-II T cells 24 h before diphtheria toxin treatment, then immunized with OVA plus papain; 4 d later, cells were restimulated for 4 d ex vivo with OVA peptide (amino acids 323–339). (d) IL-4-producing CD4+ T cells from 4get mice given no pretreatment (dimethyl sulfoxide (DMSO)) or pretreated with pertussis toxin (PTX) or BW245c, then immunized with OVA plus papain; IL-4 was assessed 4 d later as green fluorescent protein (GFP). (e) IL-4-producing CD4+ T cells 4 d after immunization with OVA plus papain, with the site of immunization excised 6 h after immunization. Numbers above outlined areas (d,e) indicate percent IL-4+CD4+ T cells. (f) Immunofluorescence microscopy of frozen sections of draining lymph nodes (n = 2) from mice 2 h after injection of Alexa Fluor 488–labeled papain (green). Blue, B220 (B cell–associated marker); red, Thy-1.2 (CD90.2); right, enlargement of area outlined at left. Original magnification, ×5 (left) or ×20 (right). (g) Production of IL-4 and IFN-γ by CD4+ T cells (left) and anti-OVA IgG1 and IgG2b in serum (right; day 14) from wild-type mice and Langerhans cell–depleted langerin-DTR mice (–LC) after immunization with OVA plus papain, as described in a. *, P < 0.05 (t-test). (h) Uptake of OVA or papain by DC subsets (identified and defined as described in Results) in draining lymph nodes isolated from mice 24 h after subcutaneous immunization with Alexa Fluor 647–labeled OVA (OVA-A647) plus papain, or Alexa Fluor 488–labeled papain (Papain-A488) alone. Bottom, proportion of fluorescence-labeled cells in conventional DC (cDC) subsets. SSC, side scatter; LC, Langerhans cell; dDC, dermal DC. (i) Pooled data from h. (j) Immunostimulatory capacity of the four lymph node DC subsets sorted by flow cytometry from mice immunized 24 h earlier with OVA plus papain or OVA plus LPS, then cultured with OT-II CD4+ T cells; proliferation was assessed by thymidine labeling. *P < 0.05, **P < 0.01 and ***P < 0.001 (analysis of variance). Data are representative of three to five independent experiments (mean and s.e.m.).
Figure 2
Figure 2
DCs and basophils act in concert to drive TH2 responses. (a) Production of IFN-γ and IL-4 by OT-II CD4+ T cells after culture with CD11c+ lymph node DCs from mice immunized 24 h before with OVA plus papain or OVA plus CpG. (b) Flow cytometry analysis of IL-4 expression (middle) by IgE+DX5+ basophils (blue line) and nonbasophils (red line) sorted (left) from draining lymph nodes of 4get mice immunized subcutaneously 3 d earlier with papain, and ELISA of IL-4 production by flow cytometry–sorted basophils from mice immunized subcutaneously with papain plus OVA (right). Med, well with medium only. Number above outlined area (left) indicates percent IgE+DX5+ cells. (c) IL-4 production by cocultures of OT-II CD4+ T cells and CD11c+ DCs, basophils or a combination of DCs plus basophils isolated from mice immunized with OVA plus papain. (d) Intracellular flow cytometry analysis of IL-4-producing OT-II CD4+ T cells cultured as in c. Numbers adjacent to outlined areas indicate percent IL-4+CD4+ cells. (e) Proliferation of OT-II CD4+ T cells stimulated in vitro with various numbers of lymph node CD11c+ DCs or basophils isolated from mice immunized with OVA plus papain, with no exogenous OVA added, assessed by [3H]thymidine incorporation. (f) Proliferation of OT-II cells (labeled with the cytosolic dye CFSE) from unimmunized mice (Naive) or mice immunized with OVA plus papain and assessed with no further treatment (PBS), after ablation of skin-derived DCs by ear excision 6 h after immunization, or after depletion of basophils with MAR-1. Numbers above bracketed lines indicate percent CSFE+ (dividing) cells. (g) Flow cytometry analysis of IL-4 expression in CD4+ T cells in 4get mice, assessed (as green fluorescent protein) after basophil depletion and immunization as in f. Numbers above outlined areas indicate percent IL-4+CD4+ cells. *P < 0.05 and **P < 0.01 (t-test). Data are representative of three independent experiments (error bars (ac,e), s.e.m.).
Figure 3
Figure 3
ROS production by papain-activated DCs is critical for TH2 differentiation. (a) Microarray analysis of gene expression in lymph node DCs stimulated for 4 or 17 h in vitro with papain or LPS. (b,c) Flow cytometry analysis of ROS production by untreated and papain-stimulated DCs in vitro (b) and in vivo (c). (d) Flow cytometry analysis of intracellular IFN-γ production by OT-II T cells stimulated for 72 h with lymph node DCs pulsed with OVA peptide, amino acids 323–339, alone (Med) or together with papain, LPS, or LPS plus papain. (e) IFN-γ production assessed as in d but for cells pulsed with papain alone (far left) or with papain plus NAC in the presence of neutralizing anti-CD70 (α-CD70) or anti-IL-12 (α-IL-12) or isotype-matched control antibody (Isotype). (f,g) Flow cytometry analysis of IL-4 expression (as green fluorescent protein) in CD4+ T cells from draining lymph nodes of 4get mice immunized with papain, with no pretreatment (PBS (f) or Blank (g)) or after pretreatment with NAC (f) or microparticle-encapsulated tempol (g). Numbers above outlined areas indicate percent CD4+IFN-γ+ cells (d,e) or IL-4+CD4+ cells (f,g). Data are representative of one experiment (a) or two to five experiments (bg).
Figure 4
Figure 4
TSLP production in skin in response to immunization with papain is dependent on ROS. (a) Quantitative RT-PCR analysis of TLSP mRNA expression in ears of mice injected with papain, presented relative to the expression of GAPDH mRNA (‘housekeeping’ gene encoding glyceraldehyde phosphate dehydrogenase). (b) Immunofluorescence confocal microscopy of frozen ear sections from mice immunized with OVA plus papain. Blue, DAPI (DNA-intercalating dye); green, TSLP. Original magnification, ×20. (c) Quantitative RT-PCR analysis of HO-1 mRNA expression in ears of mice injected with papain, presented relative to GAPDH mRNA expression. (d) Immunofluorescence confocal microscopy of the site of immunization with OVA plus papain, stained for DAPI (blue), hydro-Cy5 (red) and CD11c (green) to assess ROS activity. Far right, enlargement of area outlined at left; arrows indicate some hydro-Cy5 staining in DCs. Original magnification, ×20 (main images). (e) Quantitative RT-PCR analysis of TSLP mRNA expression in ears of mice injected with papain, with (WT-NAC) or without (WT) pretreatment with NAC, presented relative to GAPDH mRNA expression. (f) Flow cytometry analysis of expression of the TSLP receptor (TLSPR; blue lines) on CD11c+ and CD11c dermal hematopoietic cells (sorted as shown at left), including dermal DCs. Red lines, isotype-matched control antibody. Numbers adjacent to outlined areas (left) indicate percent CD11c+CD45+ cells (top) or CD11cCD45+ cells (bottom); MFI (right), mean fluorescent intensity. NS, not significant; *P < 0.05, **P < 0.01 and ***P < 0.001 (t-test). Data are representative of two to three independent experiments (error bars (a,c,e), s.e.m.).
Figure 5
Figure 5
Papain-induced TH2 responses are dependent on TLR4-TRIF signaling. (a) Flow cytometry of intracellular staining for IL-4 and IFN-γ in CD4+ T cells from draining lymph nodes (left) and OVA-specific antibody titers (right) of wild-type or Tlr4−/− mice immunized with OVA plus papain or OVA plus LPS. Numbers in quadrants (left) indicate percent cells in each. (b) Flow cytometry of intracellular IL-4 staining in CD4+ T cells from draining lymph nodes (above) and OVA-specific antibody titers (below) of wild-type and Trif−/− mice immunized as in a. Numbers above outlined areas (top) indicate percent IL-4+CD4+ cells. (c) Immunofluorescence microscopy of frozen tissue sections of skin at the site of immunization, obtained from C57BL/6 mice injected with PBS or papain, fixed and stained with the EO6 antibody specific for OxPLs. Far right, enlargement of area outlined at left. Original magnification, ×20 (main images). (d) Flow cytometry analysis of the expression of OxPLs in draining lymph node CD11c+ DCs from mice injected with PBS (red line) or papain (blue line). (e) Quantitative RT-PCR analysis of TSLP mRNA expression in skin tissue derived from the site of immunization of papain-injected wild-type, TLR4-deficient or TRIF-deficient mice, presented relative to GAPDH mRNA expression. *P < 0.05, **P < 0.01 and ***P < 0.001 (t-test). Data are representative of two to three independent experiments (error bars (a,b,e), s.e.m.).
Figure 6
Figure 6
Regulation of basophil migration by ROS, TLR4 and TRIF signaling in DCs. (a) RT-PCR analysis of CCL7 mRNA expression by lymph node DCs isolated from unimmunized mice (Naive; left) or mice immunized subcutaneously with papain with (right) or without (middle) NAC pretreatment. (b) CCL7 mRNA expression by lymph node DCs from wild-type, TLR4-deficient or TRIF-deficient mice left unimmunized or immunized with papain. Results in a,b are presented relative to GAPDH mRNA expression. (c) Recruitment of basophils to the lymph nodes in CD11c-DTR mice left undepleted (no DT) or depleted of DCs (DT) and then immunized subcutaneously 1 d later with papain and evaluated 3 d later. LN, lymph node. (d) Recruitment of basophils to the lymph nodes in wild-type mice immunized with papain, with (NAC) or without (PBS) pretreatment with NAC. (e) Recruitment of basophils to the lymph nodes in unimmunized mice and wild-type, Tlr4−/− and Trif−/− mice immunized with papain. *P < 0.05 (t-test). Data are representative of two to three independent experiments.

Similar articles

Cited by

References

    1. Mosmann TR, Coffman RL. TH1 and TH2 cells: different patterns of lymphokine secretion lead to different functional properties. Annu. Rev. Immunol. 1989;7:145–173. - PubMed
    1. Zhu J, Yamane H, Paul WE. Differentiation of effector CD4 T cell populations. Annu. Rev. Immunol. 2010;28:445–489. - PMC - PubMed
    1. Korn T, Bettelli E, Oukka M, Kuchroo VK. IL-17 and Th17 Cells. Annu. Rev. Immunol. 2009;27:485–517. - PubMed
    1. Steinman RM, Banchereau J. Taking dendritic cells into medicine. Nature. 2007;449:419–426. - PubMed
    1. Steinman RM. Dendritic cells in vivo: a key target for a new vaccine science. Immunity. 2008;29:319–324. - PubMed

Publication types

MeSH terms

Associated data