

The expression of twisted gastrulation in postnatal mouse brain and functional implications
- PMID: 20493240
- PMCID: PMC2971674
- DOI: 10.1016/j.neuroscience.2010.05.026
The expression of twisted gastrulation in postnatal mouse brain and functional implications
Abstract
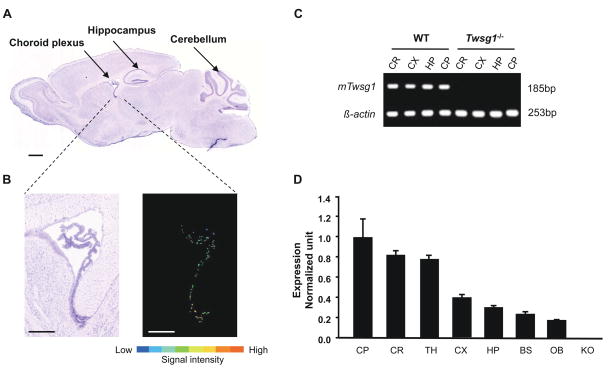
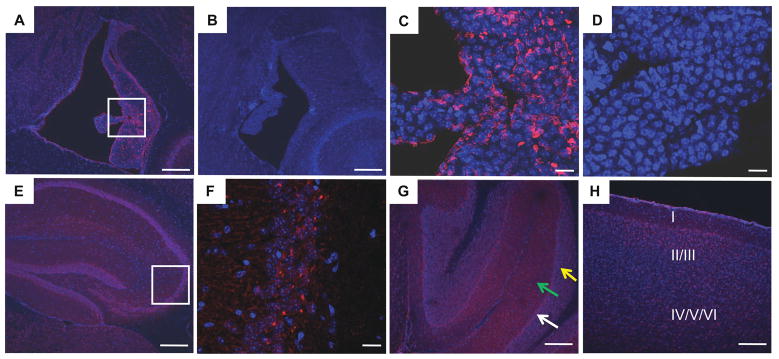
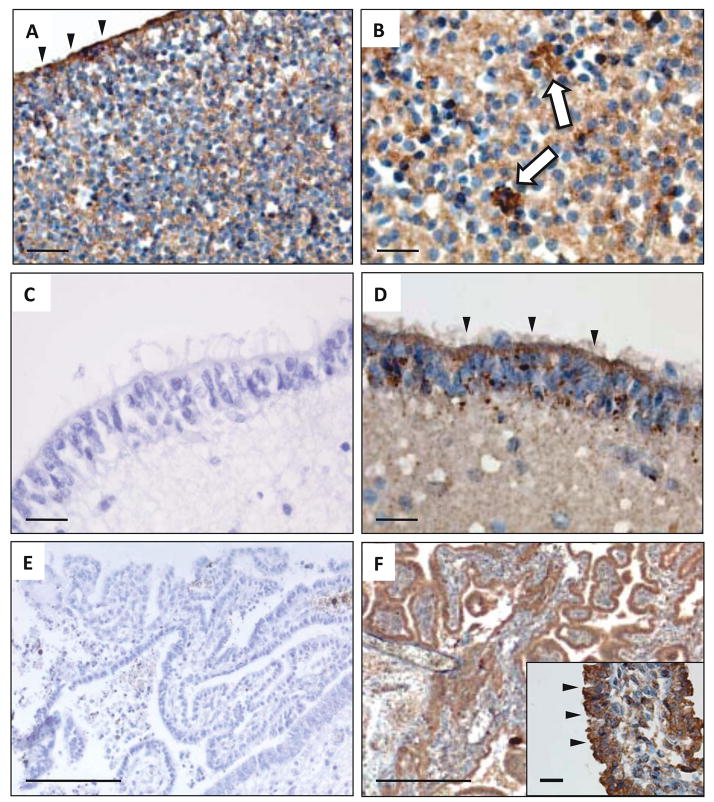
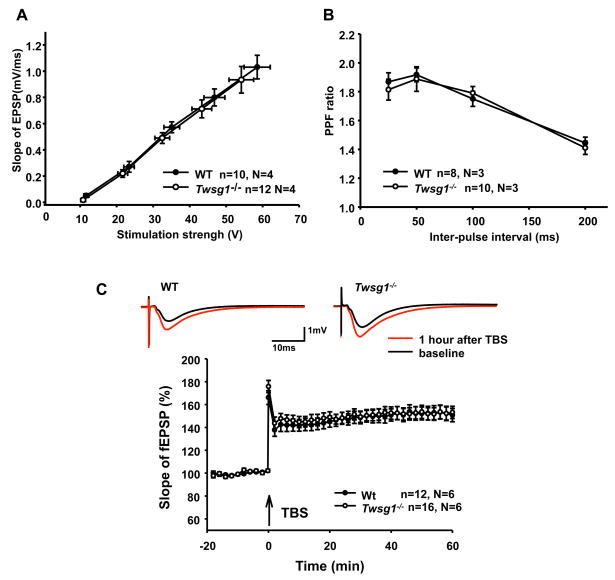
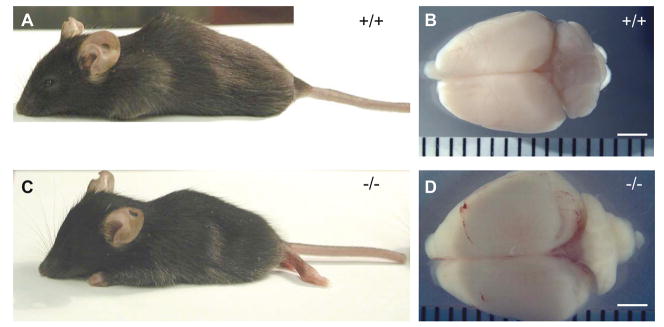
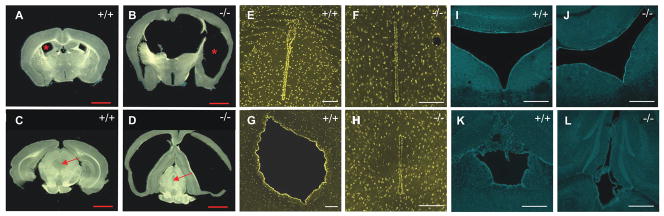
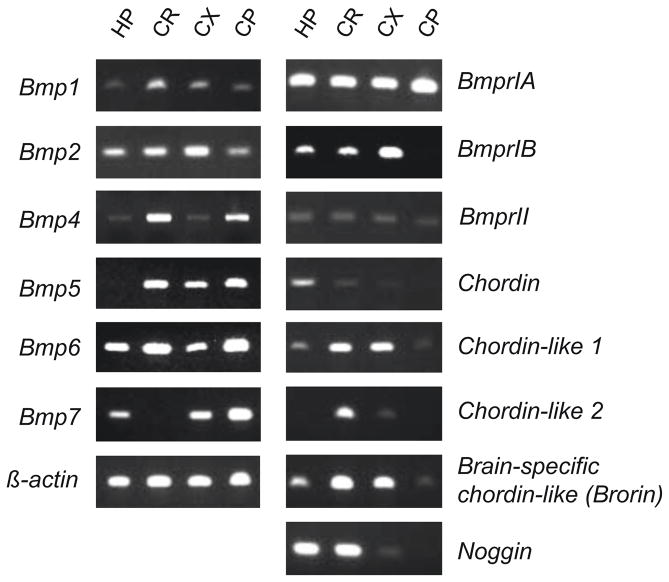
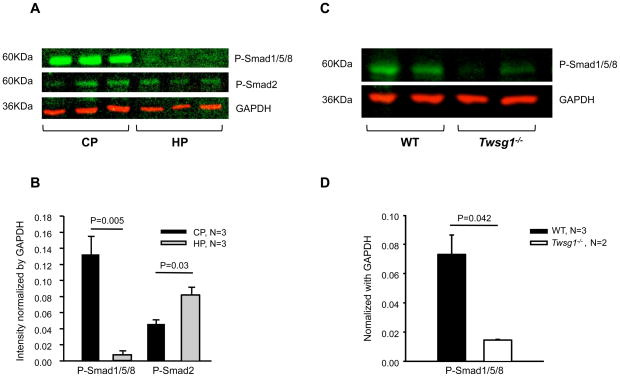
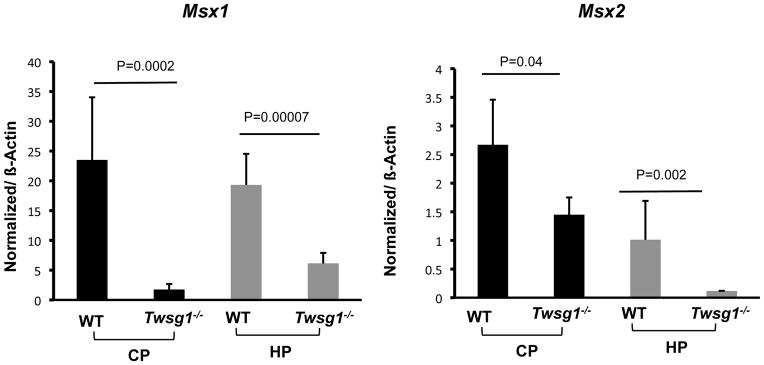
Twisted gastrulation (TWSG1), an extracellular regulator of bone morphogenetic protein (BMP) signaling, is critical for embryonic brain development. Mice deficient in TWSG1 have abnormal forebrain development manifesting as holoprosencephaly. The expression and potential roles of TWSG1 in postnatal brain development are less well understood. We show that Twsg1 is expressed in the adult mouse brain in the choroid plexus (CP), hippocampus, and other regions, with the strongest expression observed in CP. TWSG1 was also detected in a human fetal brain at mid-gestation, with highest levels in the epithelium of CP. Bmp1, Bmp2, Bmp4-Bmp7 as well as BmprIA and BmprII, but not BmprIB, were expressed in CP. BMP antagonists Chordin (Chrd) and Noggin were not detected in CP, however Chrd-like 1 and brain-specific Chrd-like (Brorin) were expressed. Electrophysiological study of synaptic plasticity revealed normal paired-pulse facilitation and long-term potentiation in the CA1 region of hippocampus in Twsg1(-/-) mice. Among the homozygous mutants that survive beyond the first 2 weeks, the prevalence of hydrocephalus was 4.3%, compared to 1.5% in a wild type colony (P=0.0133) between 3 and 10 weeks of life. We detected a high level of BMP signaling in CP in wild type adult mice that was 17-fold higher than in the hippocampus (P=0.005). In contrast, transforming growth factor beta (TGFbeta) signaling was predominant in the hippocampus. Both BMP signaling and the expression of BMP downstream targets Msx1 and Msx2 were reduced in CP in Twsg1(-/-) mice. In summary, we show that Twsg1 is expressed in the adult mouse and human fetal CP. We also show that BMP is a branch of TGFbeta superfamily that is dominant in CP. This presents an interesting avenue for future research in light of the novel roles of CP in neural progenitor differentiation and neuronal repair, especially since TWSG1 appears to be the main regulator of BMP present in CP.
Copyright (c) 2010 IBRO. Published by Elsevier Ltd. All rights reserved.
Figures
Similar articles
-
Multifaceted Functions of TWSG1: From Embryogenesis to Cancer Development.Int J Mol Sci. 2022 Oct 22;23(21):12755. doi: 10.3390/ijms232112755. Int J Mol Sci. 2022. PMID: 36361543 Free PMC article. Review.
-
The Function of Twisted Gastrulation in Regulating Osteoclast Differentiation is Dependent on BMP Binding.J Cell Biochem. 2015 Oct;116(10):2239-46. doi: 10.1002/jcb.25174. J Cell Biochem. 2015. PMID: 25808976 Free PMC article.
-
Enhanced osteoclastogenesis causes osteopenia in twisted gastrulation-deficient mice through increased BMP signaling.J Bone Miner Res. 2009 Nov;24(11):1917-26. doi: 10.1359/jbmr.090507. J Bone Miner Res. 2009. PMID: 19419314 Free PMC article.
-
Expression profiling of ovarian BMP antagonists reveals the potential interaction between TWSG1 and the chordin subfamily in the ovary.Mol Cell Endocrinol. 2021 Dec 1;538:111457. doi: 10.1016/j.mce.2021.111457. Epub 2021 Sep 11. Mol Cell Endocrinol. 2021. PMID: 34517078
-
Bone morphogenetic proteins.Growth Factors. 2004 Dec;22(4):233-41. doi: 10.1080/08977190412331279890. Growth Factors. 2004. PMID: 15621726 Review.
Cited by
-
The molecular and cellular basis of variable craniofacial phenotypes and their genetic rescue in Twisted gastrulation mutant mice.Dev Biol. 2011 Jul 1;355(1):21-31. doi: 10.1016/j.ydbio.2011.04.026. Epub 2011 Apr 28. Dev Biol. 2011. PMID: 21549111 Free PMC article.
-
SMURF1 silencing diminishes a CD44-high cancer stem cell-like population in head and neck squamous cell carcinoma.Mol Cancer. 2014 Dec 3;13:260. doi: 10.1186/1476-4598-13-260. Mol Cancer. 2014. PMID: 25471937 Free PMC article.
-
Multifaceted Functions of TWSG1: From Embryogenesis to Cancer Development.Int J Mol Sci. 2022 Oct 22;23(21):12755. doi: 10.3390/ijms232112755. Int J Mol Sci. 2022. PMID: 36361543 Free PMC article. Review.
-
Proteomic basis of mortality resilience mediated by FOXO3 longevity genotype.Geroscience. 2023 Aug;45(4):2303-2324. doi: 10.1007/s11357-023-00740-6. Epub 2023 Mar 7. Geroscience. 2023. PMID: 36881352 Free PMC article.
-
Autosomal dominant mesomandibular fibro-osseous dysplasia: a self-resolving inherited fibro-osseous lesion of the jaws.Front Physiol. 2012 Dec 6;3:458. doi: 10.3389/fphys.2012.00458. eCollection 2012. Front Physiol. 2012. PMID: 23230423 Free PMC article.
References
-
- Anderson RM, Lawrence AR, Stottmann RW, Bachiller D, Klingensmith J. Chordin and noggin promote organizing centers of forebrain development in the mouse. Development. 2002;129:4975–4987. - PubMed
-
- Balemans W, Van Hul W. Extracellular regulation of BMP signaling in vertebrates: a cocktail of modulators. Dev Biol. 2002;250:231–250. - PubMed
-
- Berdal A, Molla M, Hotton D, Aioub M, Lezot F, Nefussi JR, Goubin G. Differential impact of MSX1 and MSX2 homeogenes on mouse maxillofacial skeleton. Cells Tissues Organs. 2009;189:126–132. - PubMed
-
- Brodbelt A, Stoodley M. CSF pathways: a review. Br J Neurosurg. 2007;21:510–520. - PubMed
Publication types
MeSH terms
Substances
Grants and funding
LinkOut - more resources
Full Text Sources
Molecular Biology Databases
Miscellaneous
