Loss of naive T cells and repertoire constriction predict poor response to vaccination in old primates
- PMID: 20483749
- PMCID: PMC3504654
- DOI: 10.4049/jimmunol.0904193
Loss of naive T cells and repertoire constriction predict poor response to vaccination in old primates
Erratum in
- J Immunol. 2010 Oct 1;185(7):4509. Smyk-Paerson, Sue [corrected to Smyk-Pearson, Susan]; Axthelm, Michael T [corrected to Axthelm, Michael K]
Abstract
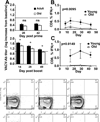
Aging is usually accompanied by diminished immune protection upon infection or vaccination. Although aging results in well-characterized changes in the T cell compartment of long-lived, outbred, and pathogen-exposed organisms, their relevance for primary Ag responses remain unclear. Therefore, it remains unclear whether and to what extent the loss of naive T cells, their partial replacement by oligoclonal memory populations, and the consequent constriction of TCR repertoire limit the Ag responses in aging primates. We show in this study that aging rhesus monkeys (Macaca mulatta) exhibit poor CD8 T cell and B cell responses in the blood and poor CD8 responses in the lungs upon vaccination with the modified vaccinia strain Ankara. The function of APCs appeared to be maintained in aging monkeys, suggesting that the poor response was likely intrinsic to lymphocytes. We found that the loss of naive CD4 and CD8 T cells, and the appearance of persisting T cell clonal expansions predicted poor CD8 responses in individual monkeys. There was strong correlation between early CD8 responses in the transitory CD28+ CD62L- CD8+ T cell compartment and the peak Ab titers upon boost in individual animals, as well as a correlation of both parameters of immune response to the frequency of naive CD8+ T cells in old but not in adult monkeys. Therefore, our results argue that T cell repertoire constriction and naive cell loss have prognostic value for global immune function in aging primates.
Figures


Similar articles
-
A Higher Activation Threshold of Memory CD8+ T Cells Has a Fitness Cost That Is Modified by TCR Affinity during Tuberculosis.PLoS Pathog. 2016 Jan 8;12(1):e1005380. doi: 10.1371/journal.ppat.1005380. eCollection 2016 Jan. PLoS Pathog. 2016. PMID: 26745507 Free PMC article.
-
Effect of IL-7 Therapy on Naive and Memory T Cell Homeostasis in Aged Rhesus Macaques.J Immunol. 2015 Nov 1;195(9):4292-305. doi: 10.4049/jimmunol.1500609. Epub 2015 Sep 28. J Immunol. 2015. PMID: 26416281 Free PMC article.
-
Reduced naïve CD8(+) T-cell priming efficacy in elderly adults.Aging Cell. 2016 Feb;15(1):14-21. doi: 10.1111/acel.12384. Epub 2015 Oct 15. Aging Cell. 2016. PMID: 26472076 Free PMC article.
-
CD8+ T cell differentiation in the aging immune system: until the last clone standing.Curr Opin Immunol. 2011 Aug;23(4):549-54. doi: 10.1016/j.coi.2011.05.002. Epub 2011 Jun 12. Curr Opin Immunol. 2011. PMID: 21664807 Review.
-
Aging and T-cell diversity.Exp Gerontol. 2007 May;42(5):400-6. doi: 10.1016/j.exger.2006.11.016. Epub 2007 Jan 10. Exp Gerontol. 2007. PMID: 17218073 Free PMC article. Review.
Cited by
-
An in-depth understanding of the role and mechanisms of T cells in immune organ aging and age-related diseases.Sci China Life Sci. 2024 Sep 2. doi: 10.1007/s11427-024-2695-x. Online ahead of print. Sci China Life Sci. 2024. PMID: 39231902 Review.
-
Immunological factors linked to geographical variation in vaccine responses.Nat Rev Immunol. 2024 Apr;24(4):250-263. doi: 10.1038/s41577-023-00941-2. Epub 2023 Sep 28. Nat Rev Immunol. 2024. PMID: 37770632 Review.
-
Mass Cytometry as a Tool for Investigating Senescence in Multiple Model Systems.Cells. 2023 Aug 11;12(16):2045. doi: 10.3390/cells12162045. Cells. 2023. PMID: 37626855 Free PMC article.
-
Sequential Early-Life Infections Alter Peripheral Blood Transcriptomics in Aging Female Mice but Not the Response to De Novo Infection with Influenza Virus or M. tuberculosis.Immunohorizons. 2023 Aug 1;7(8):562-576. doi: 10.4049/immunohorizons.2200066. Immunohorizons. 2023. PMID: 37555847 Free PMC article.
-
Effect of Aging on the Immune Response to Core Vaccines in Senior and Geriatric Dogs.Vet Sci. 2023 Jun 23;10(7):412. doi: 10.3390/vetsci10070412. Vet Sci. 2023. PMID: 37505818 Free PMC article.
References
-
- Miller RA. The aging immune system: primer and prospectus. Science. 1996;273:70–74. - PubMed
-
- Wikby A, Maxson P, Olsson J, Johansson B, Ferguson FG. Changes in CD8 and CD4 lymphocyte subsets, T cell proliferation responses and non-survival in the very old: the Swedish longitudinal OCTO-immune study. Mech Ageing Dev. 1998;102:187–198. - PubMed
-
- Pilarski LM, Yacyshyn BR, Jensen GS, Pruski E, Pabst HF. Beta 1 integrin (CD29) expression on human postnatal T cell subsets defined by selective CD45 isoform expression. J Immunol. 1991;147:830–837. - PubMed
-
- Monteiro J, Batliwalla F, Ostrer H, Gregersen PK. Shortened telomeres in clonally expanded CD28−CD8+ T cells imply a replicative history that is distinct from their CD28+CD8+ counterparts. J Immunol. 1996;156:3587–3590. - PubMed
Publication types
MeSH terms
Grants and funding
LinkOut - more resources
Full Text Sources
Other Literature Sources
Medical
Research Materials
Miscellaneous

