

Interferon-gamma and tumor necrosis factor-alpha induce an immunoinhibitory molecule, B7-H1, via nuclear factor-kappaB activation in blasts in myelodysplastic syndromes
- PMID: 20472834
- PMCID: PMC3375140
- DOI: 10.1182/blood-2009-12-255125
Interferon-gamma and tumor necrosis factor-alpha induce an immunoinhibitory molecule, B7-H1, via nuclear factor-kappaB activation in blasts in myelodysplastic syndromes
Abstract
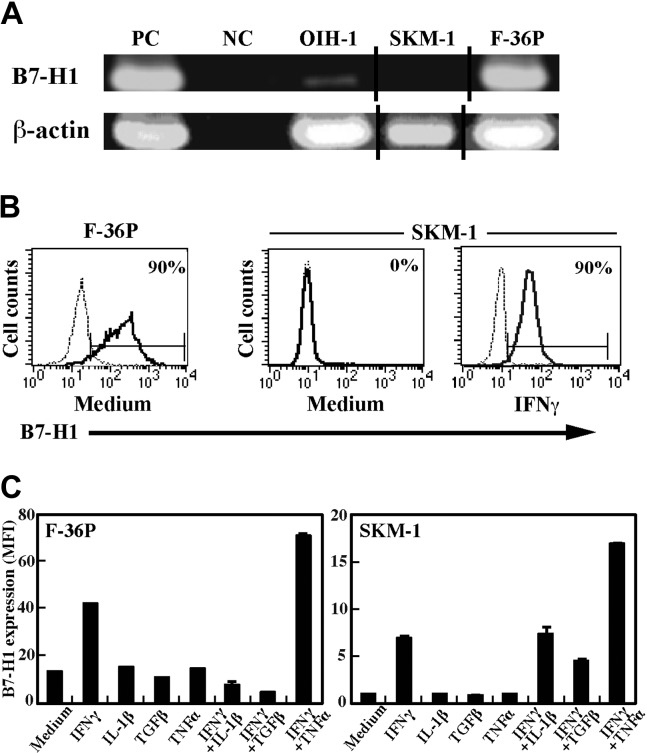
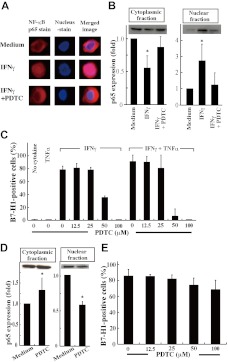
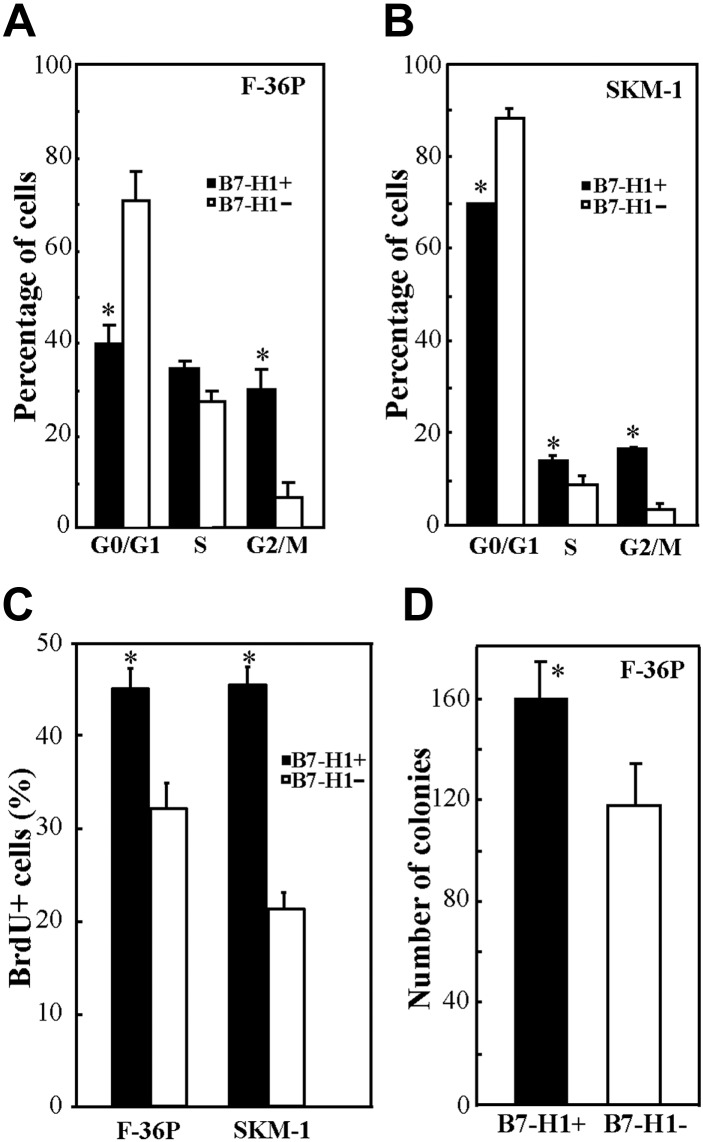
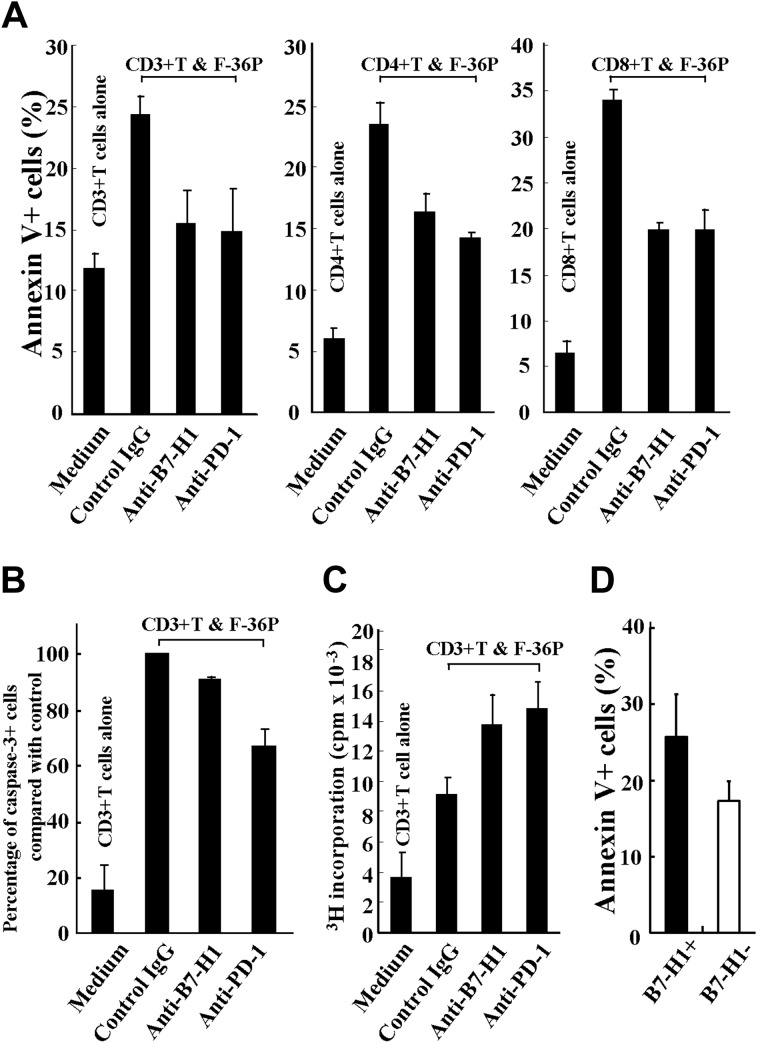
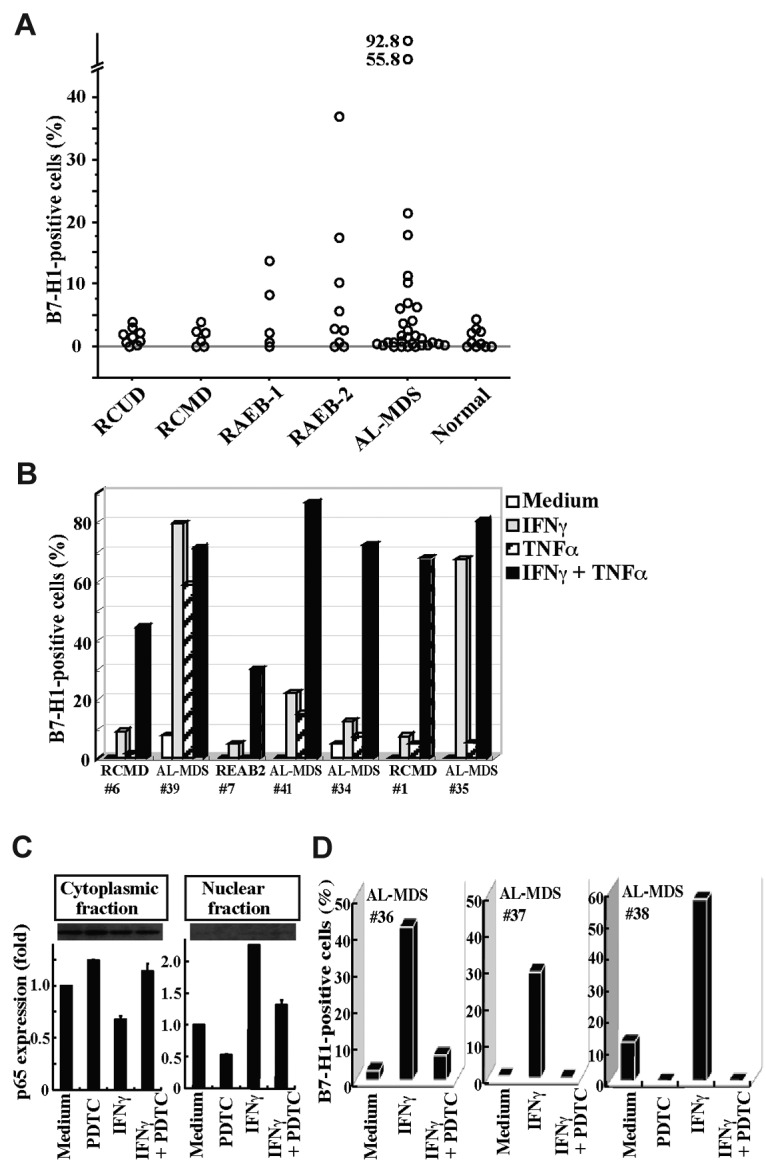
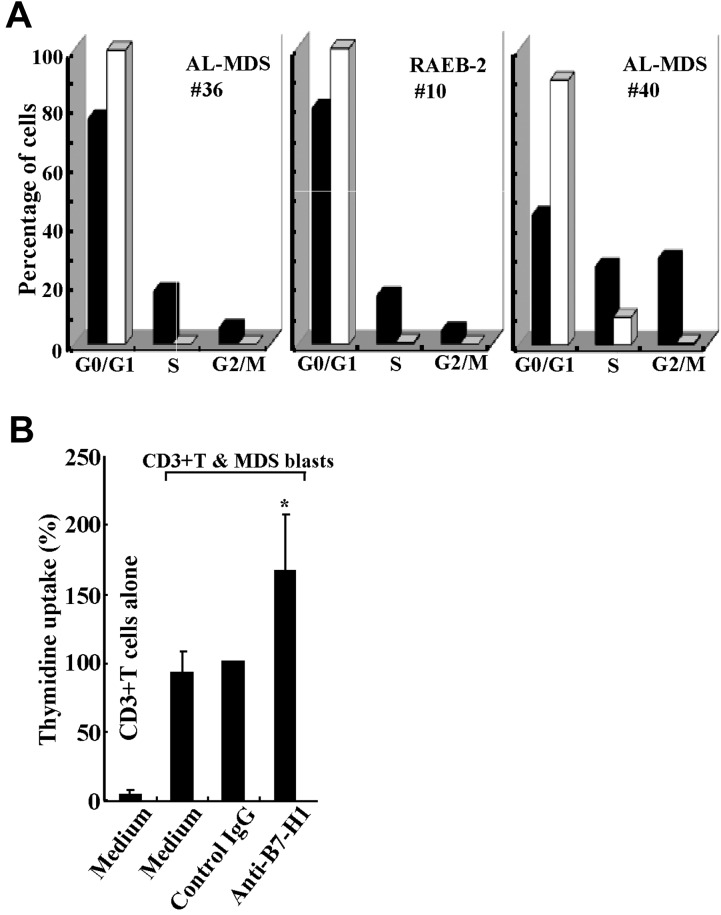
During disease progression in myelodysplastic syndromes (MDS), clonal blasts gain a more aggressive nature, whereas nonclonal immune cells become less efficient via an unknown mechanism. Using MDS cell lines and patient samples, we showed that the expression of an immunoinhibitory molecule, B7-H1 (CD274), was induced by interferon-gamma (IFNgamma) and tumor necrosis factor-alpha (TNFalpha) on MDS blasts. This induction was associated with the activation of nuclear factor-kappaB (NF-kappaB) and nearly completely blocked by an NF-kappaB inhibitor, pyrrolidine dithiocarbamate (PDTC). B7-H1(+) MDS blasts had greater intrinsic proliferative capacity than B7-H1(-) MDS blasts when examined in various assays. Furthermore, B7-H1(+) blasts suppressed T-cell proliferation and induced T-cell apoptosis in allogeneic cocultures. When fresh bone marrow samples from patients were examined, blasts from high-risk MDS patients expressed B7-H1 molecules more often compared with those from low-risk MDS patients. Moreover, MDS T cells often overexpressed programmed cell death 1 (PD-1) molecules that transmit an inhibitory signal from B7-H1 molecules. Taken together, these findings provide new insight into MDS pathophysiology. IFNgamma and TNFalpha activate NF-kappaB that in turn induces B7-H1 expression on MDS blasts. B7-H1(+) MDS blasts have an intrinsic proliferative advantage and induce T-cell suppression, which may be associated with disease progression in MDS.
Figures
Similar articles
-
Disease progression mechanism in myelodysplastic syndromes: insight into the role of the microenvironment.Leuk Res. 2011 Nov;35(11):1449-52. doi: 10.1016/j.leukres.2011.06.022. Epub 2011 Jul 14. Leuk Res. 2011. PMID: 21757231
-
Kupffer cell suppression of CD8+ T cells in human hepatocellular carcinoma is mediated by B7-H1/programmed death-1 interactions.Cancer Res. 2009 Oct 15;69(20):8067-75. doi: 10.1158/0008-5472.CAN-09-0901. Epub 2009 Oct 13. Cancer Res. 2009. PMID: 19826049 Free PMC article.
-
NF-kappaB and FLIP in arsenic trioxide (ATO)-induced apoptosis in myelodysplastic syndromes (MDSs).Blood. 2005 Dec 1;106(12):3917-25. doi: 10.1182/blood-2005-04-1424. Epub 2005 Aug 16. Blood. 2005. PMID: 16105982 Free PMC article.
-
Clinical implications of blast immunophenotypes in myelodysplastic syndromes.Leuk Lymphoma. 2005 Sep;46(9):1269-74. doi: 10.1080/10428190500142155. Leuk Lymphoma. 2005. PMID: 16109603 Review.
-
From Immune Dysregulations to Therapeutic Perspectives in Myelodysplastic Syndromes: A Review.Diagnostics (Basel). 2021 Oct 26;11(11):1982. doi: 10.3390/diagnostics11111982. Diagnostics (Basel). 2021. PMID: 34829329 Free PMC article. Review.
Cited by
-
Development of PD-1/PD-L1 Pathway in Tumor Immune Microenvironment and Treatment for Non-Small Cell Lung Cancer.Sci Rep. 2015 Aug 17;5:13110. doi: 10.1038/srep13110. Sci Rep. 2015. PMID: 26279307 Free PMC article. Review.
-
HBD3 Induces PD-L1 Expression on Head and Neck Squamous Cell Carcinoma Cell Lines.Antibiotics (Basel). 2019 Sep 24;8(4):161. doi: 10.3390/antibiotics8040161. Antibiotics (Basel). 2019. PMID: 31554151 Free PMC article.
-
Use of archival versus newly collected tumor samples for assessing PD-L1 expression and overall survival: an updated analysis of KEYNOTE-010 trial.Ann Oncol. 2019 Feb 1;30(2):281-289. doi: 10.1093/annonc/mdy545. Ann Oncol. 2019. PMID: 30657853 Free PMC article. Clinical Trial.
-
Fus1/Tusc2 is a novel regulator of mitochondrial calcium handling, Ca2+-coupled mitochondrial processes, and Ca2+-dependent NFAT and NF-κB pathways in CD4+ T cells.Antioxid Redox Signal. 2014 Apr 1;20(10):1533-47. doi: 10.1089/ars.2013.5437. Epub 2014 Feb 4. Antioxid Redox Signal. 2014. PMID: 24328503 Free PMC article.
-
Hypomethylation and up-regulation of PD-1 in T cells by azacytidine in MDS/AML patients: A rationale for combined targeting of PD-1 and DNA methylation.Oncotarget. 2015 Apr 20;6(11):9612-26. doi: 10.18632/oncotarget.3324. Oncotarget. 2015. PMID: 25823822 Free PMC article.
References
-
- Dong H, Zhu G, Tamada K, Chen L. B7-H1, a third member of the B7 family, co-stimulates T-cell proliferation and interleukin-10 secretion. Nat Med. 1999;5(12):1365–1369. - PubMed
-
- Tamura H, Dong H, Zhu G, et al. B7-H1 costimulation preferentially enhances CD28-independent T-helper cell function. Blood. 2001;97(6):1809–1816. - PubMed
Publication types
MeSH terms
Substances
Grants and funding
LinkOut - more resources
Full Text Sources
Other Literature Sources
Medical
Research Materials
Miscellaneous
